. 2006 Jul 25;103(30):11154-9.
doi: 10.1073/pnas.0603672103. Epub 2006 Jul 18.

Ovarian cancer side population defines cells with stem cell-like characteristics and Mullerian Inhibiting Substance responsiveness

Affiliations

Ovarian cancer side population defines cells with stem cell-like characteristics and Mullerian Inhibiting Substance responsiveness

Paul P Szotek et al. Proc Natl Acad Sci U S A. .

Abstract

The recent identification of "side population" (SP) cells in a number of unrelated human cancers and their normal tissue sources has renewed interest in the hypothesis that cancers may arise from somatic stem/progenitor cells. The high incidence of recurrence attributable to multidrug resistance and the multiple histologic phenotypes indicative of multipotency suggests a stem cell-like etiology of ovarian cancer. Here we identify and characterize SP cells from two distinct genetically engineered mouse ovarian cancer cell lines. Differential efflux of the DNA-binding dye Hoechst 33342 from these cell lines defined a human breast cancer-resistance protein 1-expressing, verapamil-sensitive SP of candidate cancer stem cells. In vivo, mouse SP cells formed measurable tumors sooner than non-SP (NSP) cells when equal numbers were injected into the dorsal fat pad of nude mice. The presence of Mullerian Inhibiting Substance (MIS) signaling pathway transduction molecules in both SP and NSP mouse cells led us to investigate the efficacy of MIS against these populations in comparison with traditional chemotherapies. MIS inhibited the proliferation of both SP and NSP cells, whereas the lipophilic chemotherapeutic agent doxorubicin more significantly inhibited the NSP cells. Finally, we identified breast cancer-resistance protein 1-expressing verapamil-sensitive SPs in three of four human ovarian cancer cell lines and four of six patient primary ascites cells. In the future, individualized therapy must incorporate analysis of the stem cell-like subpopulation of ovarian cancer cells when designing therapeutic strategies for ovarian cancer patients.


Conflict of interest statement

Conflict of interest statement: No conflicts declared.

Figures
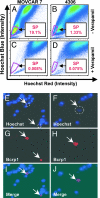
Fig. 1.
Fig. 1.
Identification of SP cells in established mouse ovarian cancer cell lines. MOVCAR 7 and 4306 cell lines were labeled with Hoechst 33342 dye and analyzed by flow cytometry before (A and B) and after (C and D) treatment with verapamil. MOVCAR 7 and 4306 cells were examined for colocalization of Brcp1 immunoreactivity and Hoechst dye uptake. HoechstLow cells (E and F; dashed circle and arrows) show Bcrp1 immunoreactivity (G and H; arrows). HoechstLow cells colocalize with Bcrp1-positive cells (I and J; arrows).
Fig. 2.
Fig. 2.
Growth characteristics of mouse SP cells. MOVCAR 7 and 4306 SP (A and C) and NSP (B and D) cells recovered in culture and photographed with an inverted ×10 phase-contrast microscope. SP cells from both cell lines form tight colonies after 4 days in culture, whereas NSP cells are scattered and do not proliferate. MOVCAR 7- and 4306-sorted SP cells (E and H) were cultured for 7–10 days, resorted by flow cytometry (F and I), recovered for an additional 7–10 days, and then reanalyzed by flow cytometry (G and J). Each successive sort demonstrated the enrichment of SP cells and the presence of NSP cells.
Fig. 3.
Fig. 3.
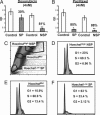
SP cells demonstrate decreased inhibition by doxorubicin and G1 cell cycle arrest. MOVCAR 7 cells were sorted for MTT growth-inhibition analysis against doxorubicin and paclitaxel. SP cells showed 30% inhibition (A) by doxorubicin (∗, P < 4.2 × 10⁻⁴) and 85% inhibition (B) by paclitaxel (∗, P < 6.7 × 10⁻¹⁰) compared with vehicle-treated controls. NSP cells were inhibited by doxorubicin and paclitaxel by 81% and 88% versus vehicle-treated controls [∗∗, P < 3.2 × 10⁻¹¹ (A); ∗∗, P < 5.1 × 10⁻¹⁰ (B)]. (A) NSP cells were significantly more inhibited by doxorubicin than by SP cells (81% versus 30% growth inhibition; ∗∗∗, P < 1.6 × 10⁻⁹). Cell cycle analysis of three populations was performed as shown in C. HoechstHigh NSP and HoechstMid cells (D and E) demonstrate a predominance of S phase, 69.3% (average = 45.3%) and 68.9% (average = 51.5%), respectively, and decreased G1-arrested cells, 23% (average = 53%) and 15.9% (average = 39%), compared with HoechstLow SP cells [P < 0.0407 (F)]. HoechstLow SPs demonstrate a predominance of G1-arrested cells, 63% (average = 65.8%), and decreased S phase replicating cells, 33.4% (30.57%). All experiments were performed in triplicate.
Fig. 4.
Fig. 4.
In vivo growth characteristics of MOVCAR 7 SP and NSP cells. MOVCAR 7 cells were sorted for SP and NSP (A), and nude mice were injected with equal numbers of SP and NSP cells [group I, 5 × 10⁵ cells per animal (B); group II, 7.5 × 10⁵ cells per animal (data not shown)]. Measurable tumors were detected in SP-injected group I animals at 10 weeks (three of three) (B) and SP-injected group II animals at 7 weeks (Table 1) after implantation, whereas group I (zero of three) (B) and group II NSP-injected animals did not demonstrate tumors at the first appearance of SP tumors. The appearance of NSP tumors was delayed in group I and II NSP tumors until 14 and 11 weeks after injection. Sorting purity analysis (C and D) showed an ≈93% purity in both SP and NSP sorts, identifying contamination by NSP sorts with SP cells. NSP tumors harvested after euthanization revealed the presence of a verapamil-sensitive SP of similar percentage to that initially injected due to incomplete sorting (E and F).
Fig. 5.
Fig. 5.
MOVCAR 7 SP cells respond to MIS in vitro. MOVCAR 7 cells express the MISRII by epifluorescent and confocal microscopy (AC). RT-PCR evaluation of SP cells demonstrated the presence of an intact MIS signaling pathway (D, left to right: SMAD 1, SMAD 5, SMAD 8, MIS type I receptors Alk 2 and Alk 3, and the MISRII). The proliferation of MOVCAR 7 SP and NSP cells were analyzed after the first sort by MTT assay (E) and demonstrate inhibition of both SP (86%) and NSP (93%) cells by MIS versus vehicle. SP cells were serially sorted two more times, demonstrating that enriched SP cells remain responsive to MIS (F, 93% inhibition; G, 94% inhibition). All experiments were performed in triplicate.
Fig. 6.
Fig. 6.
Human ovarian cancer cell lines and primary ascites from patients have SPs and express the BCRP1 transporter. Human ovarian cancer cell line IGROV-1 had a verapamil-sensitive SP (A and E), whereas OVCAR-8 did not (B and F). Human serous adenocarcinoma ascites patients 215 and 216 have small verapamil-sensitive SPs (C, D, G, and H). Immunofluorescent analysis of IGROV-1 and the ascites cells of patients 215 and 216 demonstrate colocalization of BCRP1 with HoechstLow cells (I, K, and L; white arrows), whereas OVCAR-8 did not express HoechstLow or BCRP1-positive cells (J).

References

    1. Al-Hajj M., Wicha M. S., Benito-Hernandez A., Morrison S. J., Clarke M. F. Proc. Natl. Acad. Sci. USA. 2003;100:3983–3988. - PMC - PubMed
    1. Haraguchi N., Utsunomiya T., Inoue H., Tanaka F., Mimori K., Barnard G. F., Mori M. Stem Cells (Dayton, Ohio) 2006;24:506–513. - PubMed
    1. Kondo T., Setoguchi T., Taga T. Proc. Natl. Acad. Sci. USA. 2004;101:781–786. - PMC - PubMed
    1. Wulf G. G., Wang R. Y., Kuehnle I., Weidner D., Marini F., Brenner M. K., Andreeff M., Goodell M. A. Blood. 2001;98:1166–1173. - PubMed
    1. Seigel G. M., Campbell L. M., Narayan M., Gonzalez-Fernandez F. Mol. Vis. 2005;11:729–737. - PubMed

Publication types