

Regulation of intracellular free calcium concentration during heterocyst differentiation by HetR and NtcA in Anabaena sp. PCC 7120
- PMID: 16849429
- PMCID: PMC1544087
- DOI: 10.1073/pnas.0602839103
Regulation of intracellular free calcium concentration during heterocyst differentiation by HetR and NtcA in Anabaena sp. PCC 7120
Abstract
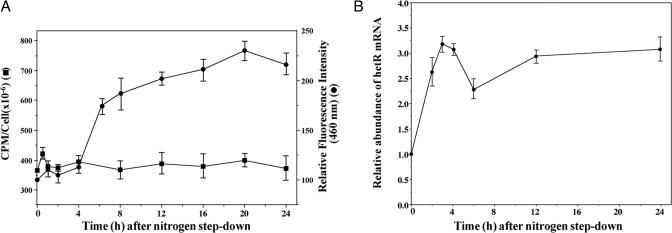
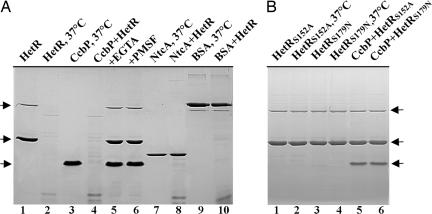
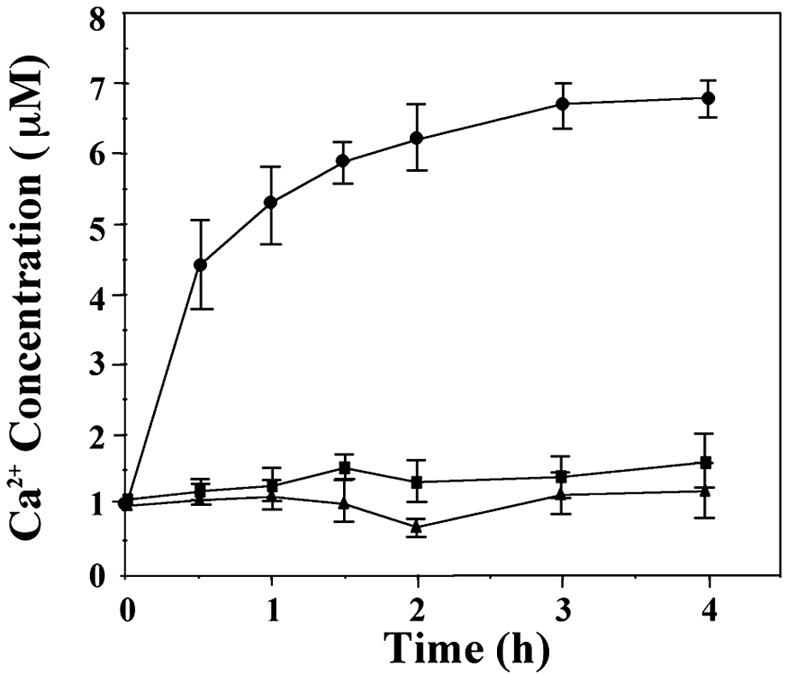
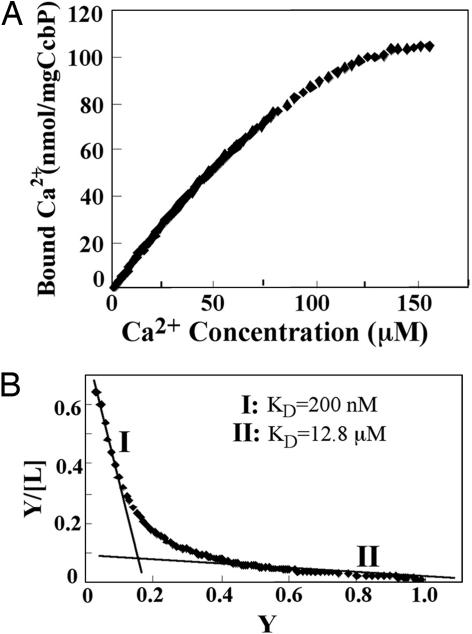
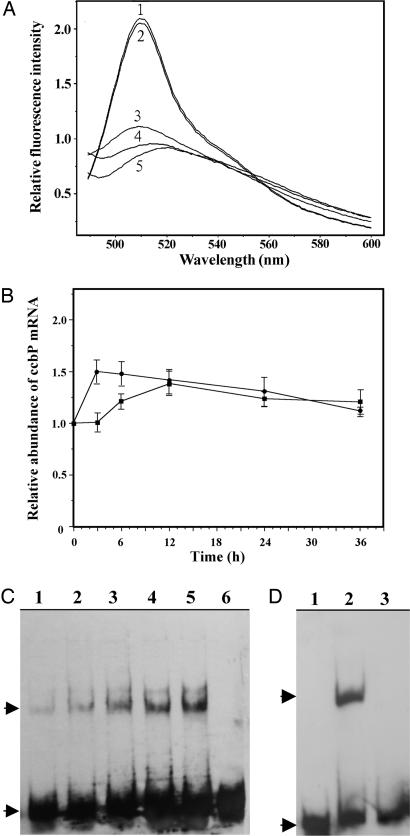
Calcium ions are important to some prokaryotic cellular processes, such as heterocyst differentiation of cyanobacteria. Intracellular free Ca(2+)concentration, [Ca(2+)](i), increases several fold in heterocysts and is regulated by CcbP, a Ca(2+)-binding protein found in heterocyst-forming cyanobacteria. We demonstrate here that CcbP is degraded by HetR, a serine-type protease that controls heterocyst differentiation. The degradation depends on Ca(2+) and appears to be specific because HetR did not digest other tested proteins. CcbP was found to bind two Ca(2+) per molecule with K(D) values of 200 nM and 12.8 microM. Degradation of CcbP releases bound Ca(2+) that contributes significantly to the increase of [Ca(2+)](i) during the process of heterocyst differentiation in Anabaena sp. strain PCC 7120. We suggest that degradation of CcbP is a mechanism of positive autoregulation of HetR. The down-regulation of ccbP in differentiating cells and mature heterocysts, which also is critical to the regulation of [Ca(2+)](i), depends on NtcA. Coexpression of ntcA and a ccbP promoter-controlled gfp in Escherichia coli diminished production of GFP, and the decrease is enhanced by alpha-ketoglutarate. It was also found that NtcA could bind a fragment of the ccbP promoter containing an NtcA-binding sequence in a alpha-ketoglutarate-dependent fashion. Therefore, [Ca(2+)](i) is regulated by a collaboration of HetR and NtcA in heterocyst differentiation in Anabaena sp. strain PCC 7120.
Conflict of interest statement
Conflict of interest statement: No conflicts declared.
Figures
Similar articles
-
The Anabaena sp. strain PCC 7120 asr1734 gene encodes a negative regulator of heterocyst development.Mol Microbiol. 2007 May;64(3):782-94. doi: 10.1111/j.1365-2958.2007.05698.x. Mol Microbiol. 2007. PMID: 17462023
-
Localized induction of the ntcA regulatory gene in developing heterocysts of Anabaena sp. strain PCC 7120.J Bacteriol. 2006 Sep;188(18):6694-9. doi: 10.1128/JB.00509-06. J Bacteriol. 2006. PMID: 16952962 Free PMC article.
-
All4312, an NtcA-regulated two-component response regulator in Anabaena sp. strain PCC 7120.FEMS Microbiol Lett. 2006 Mar;256(1):171-7. doi: 10.1111/j.1574-6968.2006.00136.x. FEMS Microbiol Lett. 2006. PMID: 16487336
-
Cellular differentiation and the NtcA transcription factor in filamentous cyanobacteria.FEMS Microbiol Rev. 2004 Oct;28(4):469-87. doi: 10.1016/j.femsre.2004.04.003. FEMS Microbiol Rev. 2004. PMID: 15374662 Review.
-
The cell wall in heterocyst formation by Anabaena sp. PCC 7120.J Basic Microbiol. 2009 Feb;49(1):5-24. doi: 10.1002/jobm.200800300. J Basic Microbiol. 2009. PMID: 19253332 Review.
Cited by
-
Mutagenesis of hetR reveals amino acids necessary for HetR function in the heterocystous cyanobacterium Anabaena sp. strain PCC 7120.J Bacteriol. 2007 Mar;189(6):2460-7. doi: 10.1128/JB.01241-06. Epub 2007 Jan 12. J Bacteriol. 2007. PMID: 17220221 Free PMC article.
-
Plant organellar calcium signalling: an emerging field.J Exp Bot. 2012 Feb;63(4):1525-42. doi: 10.1093/jxb/err394. Epub 2011 Dec 26. J Exp Bot. 2012. PMID: 22200666 Free PMC article. Review.
-
Ellman's reagent in promoting crystallization and structure determination of Anabaena CcbP.Acta Crystallogr Sect F Struct Biol Cryst Commun. 2012 Nov 1;68(Pt 11):1409-14. doi: 10.1107/S1744309112034938. Epub 2012 Oct 30. Acta Crystallogr Sect F Struct Biol Cryst Commun. 2012. PMID: 23143261 Free PMC article.
-
CabC, an EF-hand calcium-binding protein, is involved in Ca2+-mediated regulation of spore germination and aerial hypha formation in Streptomyces coelicolor.J Bacteriol. 2008 Jun;190(11):4061-8. doi: 10.1128/JB.01954-07. Epub 2008 Mar 28. J Bacteriol. 2008. PMID: 18375559 Free PMC article.
-
Cyanobacterial heterocysts.Cold Spring Harb Perspect Biol. 2010 Apr;2(4):a000315. doi: 10.1101/cshperspect.a000315. Epub 2010 Feb 24. Cold Spring Harb Perspect Biol. 2010. PMID: 20452939 Free PMC article. Review.
References
-
- Golubic S., Sergeev V. N., Knoll A. H. Lethaia. 1995;28:285–298. - PubMed
-
- Buikema W. J., Haselkorn R. Ann. Rev. Plant Physiol. Plant Mol. Biol. 1993;44:33–52.
-
- Wolk C. P. In: Prokaryotic Development. Brun Y. V., Shimkets L. J., editors. Washington, DC: Academic; 2000. pp. 83–104.
-
- Golden J. W., Yoon H. S. Curr. Opin. Microbiol. 2003;6:557–563. - PubMed
Publication types
MeSH terms
Substances
LinkOut - more resources
Full Text Sources
Molecular Biology Databases
Miscellaneous
