. 2006 Jul 25;103(30):11423-8.
doi: 10.1073/pnas.0601438103. Epub 2006 Jul 18.

Globalization and the population structure of Toxoplasma gondii

Affiliations

Globalization and the population structure of Toxoplasma gondii

Tovi Lehmann et al. Proc Natl Acad Sci U S A. .

Abstract

Toxoplasma gondii is a protozoan parasite that infects nearly all mammal and bird species worldwide. Usually asymptomatic, toxoplasmosis can be severe and even fatal to many hosts, including people. Elucidating the contribution of genetic variation among parasites to patterns of disease transmission and manifestations has been the goal of many studies. Focusing on the geographic component of this variation, we show that most genotypes are locale-specific, but some are found across continents and are closely related to each other, indicating a recent radiation of a pandemic genotype. Furthermore, we show that the geographic structure of T. gondii is extraordinary in having one population that is found in all continents except South America, whereas other populations are generally confined to South America, and yet another population is found worldwide. Our evidence suggests that South American and Eurasian populations have evolved separately until recently, when ships populated by rats, mice, and cats provided T. gondii with unprecedented migration opportunities, probably during the transatlantic slave trade. Our results explain several enigmatic features of the population structure of T. gondii and demonstrate how pervasive, prompt, and elusive the impact of human globalization is on nature.


Conflict of interest statement

Conflict of interest statement: No conflicts declared.

Figures

Fig. 1.
Fig. 1.
A schematic showing the geographic origin of the samples (n = 275). Vertical bars over sites (where n ≥ 5) depict sample composition with respect to the four populations identified by the program structure (SA1 and SA2 predominate in South America; RW is common in all continents but is rare in South America, WW is cosmopolitan, see Results for details). Numbers indicate sample size from each locale, and their colors correspond to that of the dominant population in the sample.
Fig. 2.
Fig. 2.
Clustering of populations based on their genetic diversity was performed by using standard principal component (PC) analysis using the correlation matrix of the original variables. Per-locus estimates of expected heterozygosity (27), allele richness (28), and variance in allele size for the STR loci were used for each population (Table 2). Coordinates are the first (vertical) and second (horizontal) PCs. The first PC represented overall diversity because its eigenvector’s loadings were positive and similar in magnitude (data not shown). The first PC alone accounted for 40% of the total variation, and together with the second PC, 53% of the total variation was captured. Brz Rio, Brazil Rio; Brz Sao, Brazil Sao Paulo; Argen, Argentina; Brz Par, Brazil Parana; Venezu, Venezuela; C. Amer, Central America; Brz Amaz, Brazil Amazon; MidEast, Middle East.
Fig. 3.
Fig. 3.
Phylogenetic network showing relationships among five STR haplotypes in relation to their geographic origin and lineage (marked by 1, 2, and 3, respectively). (Inset) Magnification of the area showing the tight cluster of lineage III haplotypes (arrow). The network was derived by using the median-joining algorithm (18) (ε = 0) after processing the data with the reduced median method (19) as implemented by network 4.1. The network incorporated variation in the number of repeats (assuming the step-wise mutation model) of STR loci that were weighted inversely to their variance (M33, 9; M6, M48, and M102, 4; and M163, 3). S. America, South America; C. America, Central America; N. America, North America; M. East, Middle East.
Fig. 4.
Fig. 4.
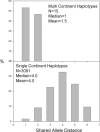
Within-group divergence between haplotypes observed on two or more continents (Upper) and those observed on one continent (Lower). Divergence was measured by the distribution of allele-sharing distance across seven loci (including the minisatellite M95, which was not included in the STR network). To avoid sampling bias, we excluded identical haplotypes. Because all (but one) multicontinent haplotypes were of lineage III, the comparison included only haplotypes of this lineage; otherwise, the difference between the distributions was even larger.
Fig. 5.
Fig. 5.
Neighbor-joining tree of haplotypes based on the shared-allele distance across six loci, showing lineage (branch color) and populations identified by structure (tip color). The observed frequency of each haplotype is shown if >1. Pie charts show geographical distribution of haplotypes found on two or more continents (color key as in Fig. 3). The distribution of multicontinent haplotypes differs slightly from the network (Fig. 3) because an additional locus (M95) is included in generating the shared-allele distance tree. (Inset) Determination of the number of populations (K) in the T. gondii gene pool using the admixture model (with independent allele frequencies) implemented by structure, based on the likelihood of observing the data and the assignment certainty (the fraction of isolates assigned into any population with probability >75%). The results are averages across three independent simulations (with 105 burn-in iterations, followed by 106 MCMC iterations).
Fig. 6.
Fig. 6.
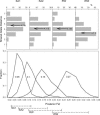
Within-population divergence measured by the shared-allele distance (Upper) and posterior FST distributions measuring divergence of the populations identified by structure from the “ancestral” population (Lower), with lines depicting the central 95% of the values of each posterior distribution. The two models identified nearly the same populations (only 13 of 275 individuals were clustered differently, comprising 4.7%). Mean FST values are shown in the center of each distribution (n = 500). Mean shared-allele distance of each population is shown with an arrow. Statistically distinct groups (P < 0.001), by using Wilcoxon two-sample test accommodating multiple comparisons, are indicated by letters.

Similar articles

Cited by

References

    1. Lindsay D. S., Blagburn B. L., Dubey J. P. Vet. Parasitol. 2002;103:309–313. - PubMed
    1. Dubey J. P. J. Parasitol. 1998;84:862–865. - PubMed
    1. Dubey J. P., Beattie C. P. Toxoplasmosis of Animals and Man. Boca Raton, FL: CRC; 1988.
    1. Dardé M. L., Bouteille B., Pestre-Alexandre M. J. Parasitol. 1992;78:786–794. - PubMed
    1. Howe D. K., Sibley L. D. J. Infect. Dis. 1995;172:1561–1566. - PubMed

Publication types

Substances