

Genome-wide in silico identification and analysis of cis natural antisense transcripts (cis-NATs) in ten species
- PMID: 16849434
- PMCID: PMC1524920
- DOI: 10.1093/nar/gkl473
Genome-wide in silico identification and analysis of cis natural antisense transcripts (cis-NATs) in ten species
Abstract
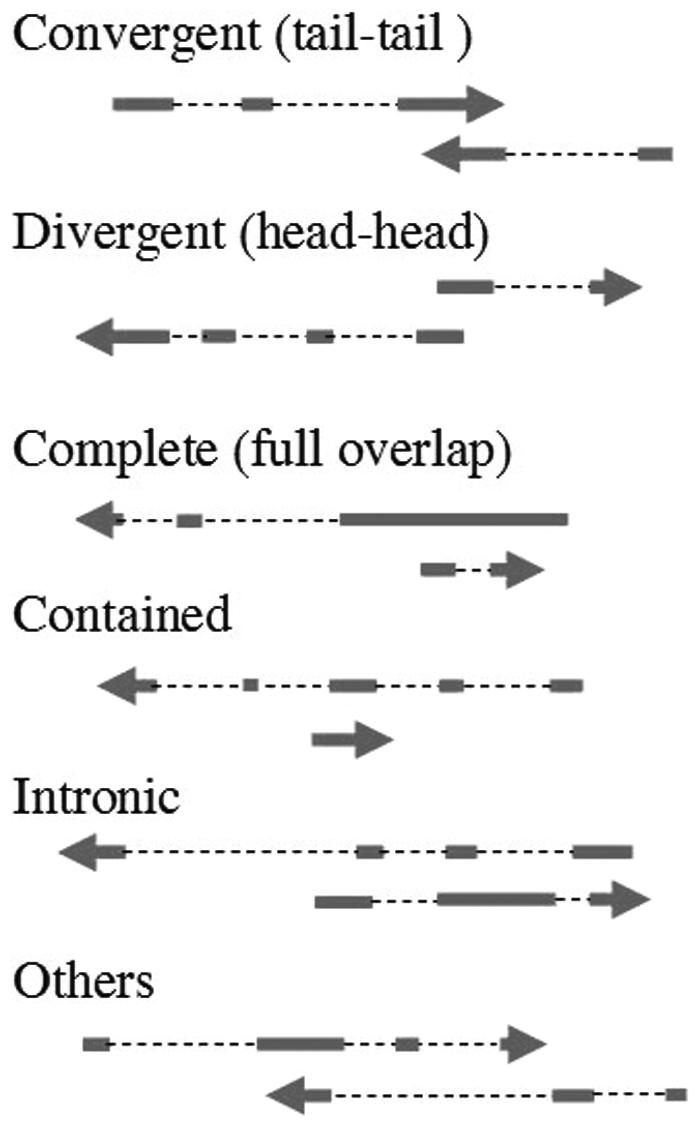
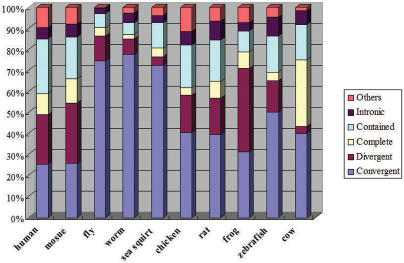
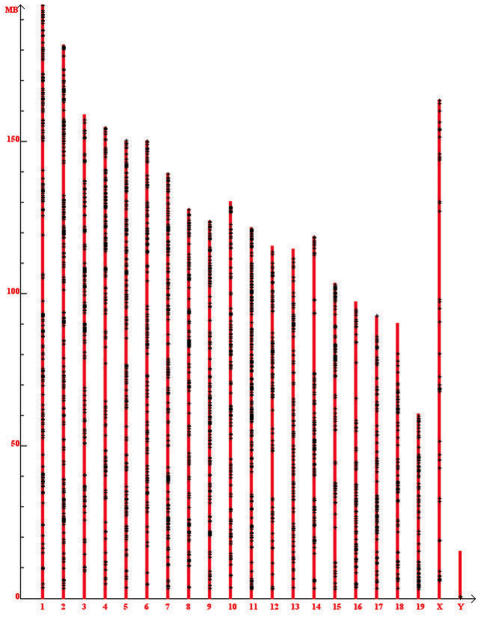
We developed a fast, integrative pipeline to identify cis natural antisense transcripts (cis-NATs) at genome scale. The pipeline mapped mRNAs and ESTs in UniGene to genome sequences in GoldenPath to find overlapping transcripts and combining information from coding sequence, poly(A) signal, poly(A) tail and splicing sites to deduce transcription orientation. We identified cis-NATs in 10 eukaryotic species, including 7830 candidate sense-antisense (SA) genes in 3915 SA pairs in human. The abundance of SA genes is remarkably low in worm and does not seem to be caused by the prevalence of operons. Hundreds of SA pairs are conserved across different species, even maintaining the same overlapping patterns. The convergent SA class is prevalent in fly, worm and sea squirt, but not in human or mouse as reported previously. The percentage of SA genes among imprinted genes in human and mouse is 24-47%, a range between the two previous reports. There is significant shortage of SA genes on Chromosome X in human and mouse but not in fly or worm, supporting X-inactivation in mammals as a possible cause. SA genes are over-represented in the catalytic activities and basic metabolism functions. All candidate cis-NATs can be downloaded from http://nats.cbi.pku.edu.cn/download/.
Figures
References
-
- Lavorgna G., Dahary D., Lehner B., Sorek R., Sanderson C.M., Casari G. In search of antisense. Trends Biochem. Sci. 2004;29:88–94. - PubMed
-
- Vanhee-Brossollet C., Vaquero C. Do natural antisense transcripts make sense in eukaryotes? Gene. 1998;211:1–9. - PubMed
-
- Carmichael G.G. Antisense starts making more sense. Nat. Biotechnol. 2003;21:371–372. - PubMed
-
- Korostishevsky M., Kaganovich M., Cholostoy A., Ashkenazi M., Ratner Y., Dahary D., Bernstein J., Bening-Abu-Shach U., Ben-Asher E., Lancet D., et al. Is the G72/G30 locus associated with schizophrenia? single nucleotide polymorphisms, haplotypes, and gene expression analysis. Biol. Psychiatry. 2004;56:169–176. - PubMed
Publication types
MeSH terms
Substances
Associated data
- Actions
Grants and funding
LinkOut - more resources
Full Text Sources
Other Literature Sources
