Comparative Study
. 2006 Aug 1;177(3):1516-25.
doi: 10.4049/jimmunol.177.3.1516.

Delayed expansion and contraction of CD8+ T cell response during infection with virulent Salmonella typhimurium

Affiliations
Comparative Study

Delayed expansion and contraction of CD8+ T cell response during infection with virulent Salmonella typhimurium

Rachel A Luu et al. J Immunol. .

Abstract

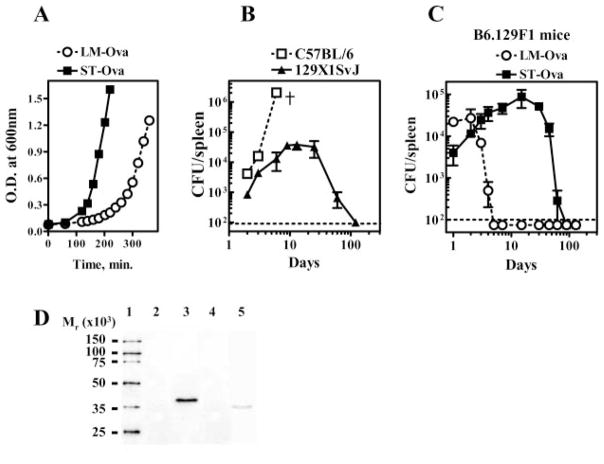
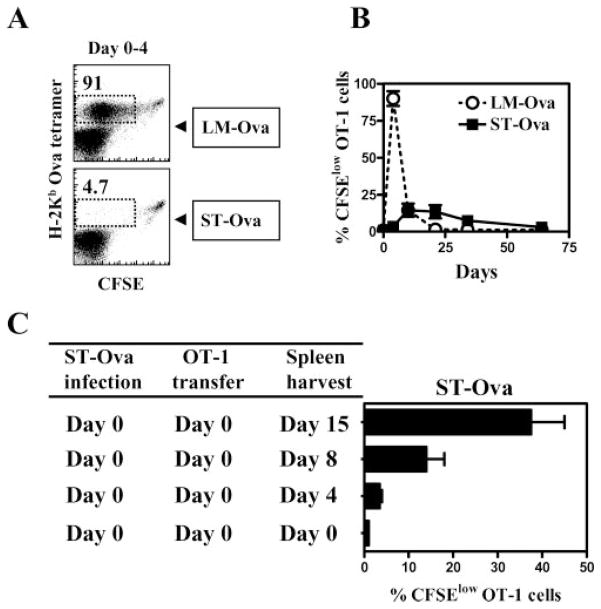
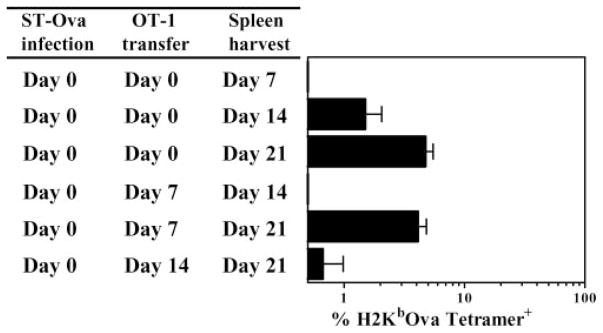
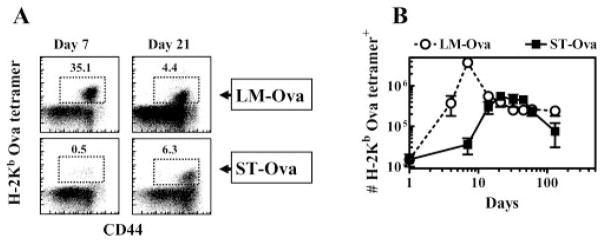
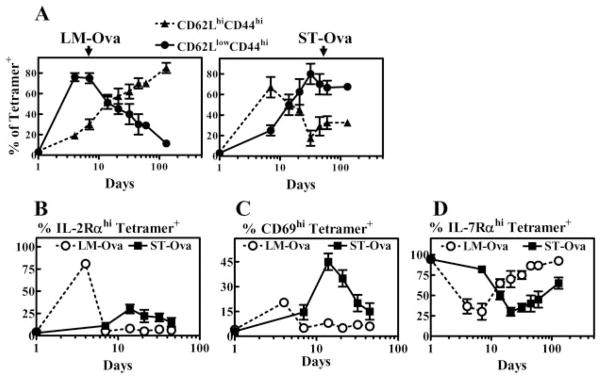
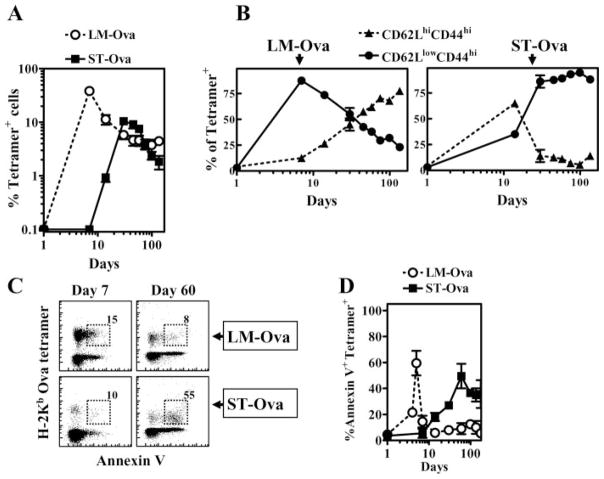
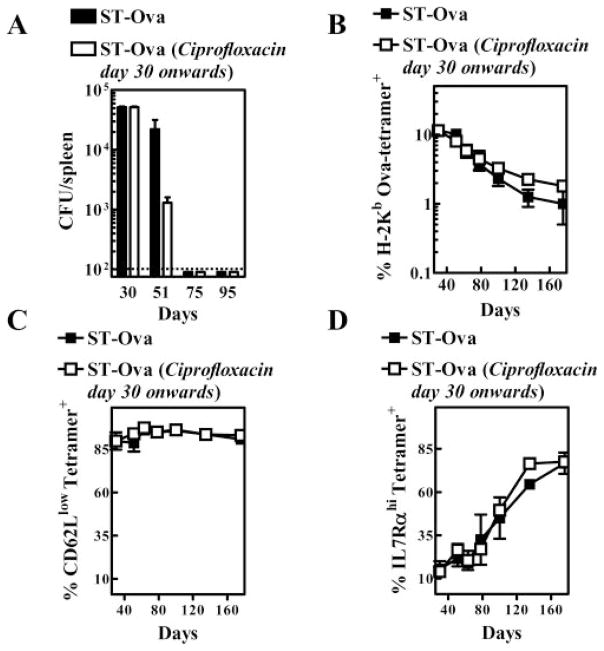
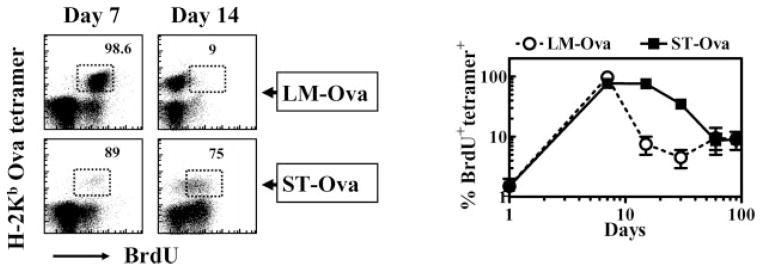
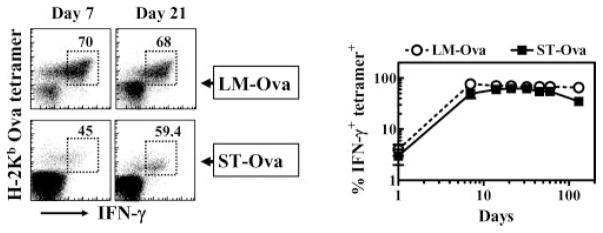
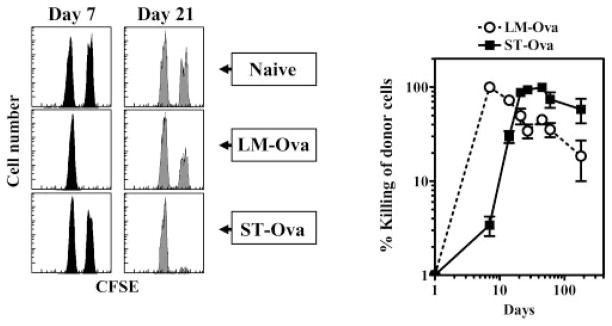
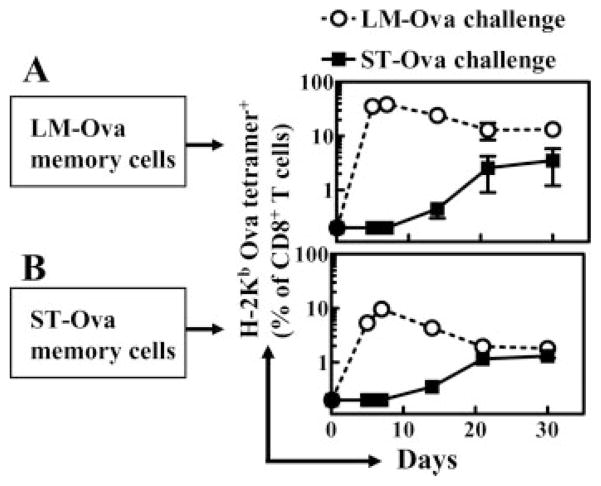
Ag presentation to CD8(+) T cells often commences immediately after infection, which facilitates their rapid expansion and control of infection. Subsequently, the primed cells undergo rapid contraction. We report that this paradigm is not followed during infection with virulent Salmonella enterica, serovar Typhimurium (ST), an intracellular bacterium that replicates within phagosomes of infected cells. Although susceptible mice die rapidly (approximately 7 days), resistant mice (129 x 1SvJ) harbor a chronic infection lasting approximately 60-90 days. Using rOVA-expressing ST (ST-OVA), we show that T cell priming is considerably delayed in the resistant mice. CD8(+) T cells that are induced during ST-OVA infection undergo delayed expansion, which peaks around day 21, and is followed by protracted contraction. Initially, ST-OVA induces a small population of cycling central phenotype (CD62L(high)IL-7Ralpha(high)CD44(high)) CD8(+) T cells. However, by day 14-21, majority of the primed CD8(+) T cells display an effector phenotype (CD62L(low)IL-7Ralpha(low)CD44(high)). Subsequently, a progressive increase in the numbers of effector memory phenotype cells (CD62L(low)IL-7Ralpha(high)CD44(high)) occurs. This differentiation program remained unchanged after accelerated removal of the pathogen with antibiotics, as majority of the primed cells displayed an effector memory phenotype even at 6 mo postinfection. Despite the chronic infection, CD8(+) T cells induced by ST-OVA were functional as they exhibited killing ability and cytokine production. Importantly, even memory CD8(+) T cells failed to undergo rapid expansion in response to ST-OVA infection, suggesting a delay in T cell priming during infection with virulent ST-OVA. Thus, phagosomal lifestyle may allow escape from host CD8(+) T cell recognition, conferring a survival advantage to the pathogen.


Conflict of interest statement

Disclosures

The authors have no financial conflict of interest.

Figures

FIGURE 1
FIGURE 1
ST-OVA induces a chronic infection in resistant mice. Liquid cultures of LM-OVA and ST-OVA were set up in multiple flasks. At various time intervals, aliquots were removed for measurement of OD at 600 nm and bacterial burden (CFUs), as described in Materials and Methods (A). C57BL/6 and 129×1SvJ mice were infected i.v. with 102 ST-OVA, and the bacterial burden in the spleens was evaluated at various time intervals (B). B6129F1 mice were infected i.v. with 103 LM-OVA or ST-OVA, and the bacterial burden in the spleens was evaluated at various time intervals (C). Mean and SD of three mice per time point are indicated. The expression of OVA (D) by LM-OVA (lane 5) vs ST-OVA (lane 3) and the parental controls ST (lane 2) and LM (lane 4) was evaluated by ECL after Western blotting, as described in Materials and Methods. Figure is representative of three such independent experiments.
FIGURE 2
FIGURE 2
Delayed and reduced Ag presentation in ST-OVA-infected mice. B6129F1 mice were infected with 103 LM-OVA or ST-OVA on day 0. Groups of mice were injected with CFSE-labeled 106 OT-1 CD8+ T cells immediately, or at various time points after infection. Four days after the OT-1 transfer, spleens were removed from recipient mice, and the reduction in the expression of CFSE was evaluated in gated tetramer+ CD8+ T cells (A and B). In another set of experiments, spleens were removed from infected recipient mice in which CFSE-labeled OT-1 cells were parked for 0, 4, 8, or 15 days (C). Mean percentage of splenic CFSElow tetramer+ cells and SDs of three mice per time period is indicated.
FIGURE 3
FIGURE 3
Absence of a CD8+ T cell clonal burst. B6129F1 mice were infected with 103 ST-OVA on day 0. Groups of mice were injected with 104 OT-1 CD8+ T cells immediately, or at various time points after infection. The percentage of tetramer+ CD8+ T cells was evaluated in the spleens of mice at various time intervals after ST-OVA infection. Mean numbers of splenic tetramer+ cells and SDs of three mice per time period are indicated.
FIGURE 4
FIGURE 4
Delayed priming of CD8+ T cells. B6129F1 mice were injected with 104 OT-1 CD8+ T cells and challenged with 103 LM-OVA or ST-OVA i.v. within 3–7 days. At various time intervals, the relative numbers of H-2KbOVA tetramer+ CD8+ T cells were evaluated in the spleens of mice (A and B). Representative flow cytometric profile of CD44 vs tetramer+ cells at days 7 and 21 in LM-OVA and ST-OVA groups is indicated (A). Mean numbers of splenic tetramer+ cells and SDs of three mice per time period are indicated (B).
FIGURE 5
FIGURE 5
ST-OVA induces a unique CD8+ T cell differentiation program. B6129F1 mice were injected with OT-1 cells and 103 LM-OVA or ST-OVA within 3–7 days, as described in Fig. 4. At various time intervals, spleens were removed and stained with various Abs and OVA tetramers. The relative induction of central (CD62LhighCD44high) vs effector (CD62LlowCD44high) phenotype cells (A), IL-2Rαhigh cells (B), CD69high cells (C), and IL-7Rαhigh cells (D) was evaluated on gated tetramer+ CD8+ T cells. Data are derived from analysis of individual spleens (n = 3) per time point. Figure is representative of three to five such experiments conducted.
FIGURE 6
FIGURE 6
Profile of CD8+ T cells in the peripheral blood. B6129F1 mice were injected with OT-1 cells and 103 LM-OVA or ST-OVA within 3–7 days, as described in Fig. 4. At various time intervals, peripheral blood was collected and stained with anti-CD8 Ab and OVA tetramers. The percentage of tetramer+ cells within gated CD8+ T cells was evaluated (A). Cells were also stained with anti-CD62L and anti-CD44 Ab (B) and annexin V (C and D). Numbers in the figure indicate the percentages of cells within gated tetramer+ cells. Data are derived from analysis of peripheral blood (n = 3) per time point.
FIGURE 7
FIGURE 7
Accelerated removal of ST-OVA does not influence the contraction or the phenotype of CD8+ T cells. B6129F1 mice were injected with OT-1 cells and 103 LM-OVA or ST-OVA within 3–7 days, as described in Fig. 4. From day 30 onward, one group of mice (n = 5) received ciprofloxacin antibiotic (1 mg/ml) in the drinking water continuously until day 180. The other control group (n = 5) received normal drinking water. Bacterial burden (A), the percentage of OVA tetramer+ CD8+ T cells (B), and the phenotype of OVA tetramer+ CD8+ T cells (C and D) were evaluated in peripheral blood by flow cytometry at various time intervals.
FIGURE 8
FIGURE 8
Cycling of Ag-specific CD8+ T cells. B6129F1 mice were injected with OT-1 cells and 103 LM-OVA or ST-OVA within 3–7 days, as described in Fig. 4. Three days before the harvest of spleens, BrdU (0.8 mg/ml) was incorporated into the drinking water of mice, which was changed daily. Spleen cells were stained with various Abs and OVA tetramers, followed by intracellular staining for BrdU. Numbers in the panels indicate the percentage of BrdU+ CD8+ T cells among the tetramer+ cells. Data are derived from analysis of individual spleens (n = 3) per time point.
FIGURE 9
FIGURE 9
Intracellular IFN-γ expression in Ag-specific CD8+ T cells. B6129F1 mice were injected with OT-1 cells and 103 LM-OVA or ST-OVA within 3–7 days, as described in Fig. 4. At various time intervals, the numbers of IFN-γ-secreting tetramer+ CD8+ T cells were evaluated after stimulation of cells for 1 h with OVA257–264. Numbers in the panels indicate the percentage of IFN-γ-secreting CD8+ T cells among the tetramer+ cells. Data are derived from analysis of individual spleens (n = 3) per time point.
FIGURE 10
FIGURE 10
In vivo cytolytic activity of Ag-specific CD8+ T cells. The 129×1SvJ mice were injected with 103 LM-OVA or ST-OVA. At various time intervals, peptide-pulsed and PKH26- and CFSE-labeled spleen cells from naive donor mice were injected into naive and infected recipients. Spleens were removed from recipients at 24 h posttransfer, and the relative numbers of peptide-pulsed vs control cells were enumerated in individual spleens. Data are derived from analysis of individual spleens (n = 3) per time point. Experiment is representative of three such experiments conducted.
FIGURE 11
FIGURE 11
Response of memory CD8+ T cells to rechallenge. B6129F1 mice were injected with OT-1 cells and 103 LM-OVA or ST-OVA within 3–7 days, as described in Fig. 4. At day 130, spleens were removed and CD8+ T cells were purified. A total of 3 and 1.5% of CD8+ T cells was tetramer+ from LM-OVA-infected (A) and ST-OVA-infected (B) spleens, respectively. Purified CD8+ T cells (5 × 10⁶/mouse) were then injected into normal B6129F1 mice that were challenged (104, i.v.) with LM-OVA or ST-OVA. At various time intervals, the percentages of tetramer+ CD8+ T cells were enumerated in the peripheral blood. Data are derived from three mice per group, and are representative of two such experiments conducted.

Similar articles

Cited by

References

    1. Bevan MJ. Antigen presentation to cytotoxic T lymphocytes in vivo. J Exp Med. 1995;182:639–634. - PMC - PubMed
    1. Kaech SM, Ahmed R. Memory CD8+ T cell differentiation: initial antigen encounter triggers a developmental program in naive cells. Nat Immunol. 2001;2:415–422. - PMC - PubMed
    1. Van Stipdonk MJ, Lemmens EE, Schoenberger SP. Naive CTLs require a single brief period of antigenic stimulation for clonal expansion and differentiation. Nat Immunol. 2001;2:423–429. - PubMed
    1. Mercado R, Vijh S, Allen SE, Kerksiek K, Pilip IM, Pamer EG. Early programming of T cell populations responding to bacterial infection. J Immunol. 2000;165:6833–6839. - PubMed
    1. Wong P, Pamer EG. Feedback regulation of pathogen-specific T cell priming. Immunity. 2003;18:499–494. - PubMed

Publication types

MeSH terms

Grants and funding