. 2006 Jul 15;66(14):7095-102.
doi: 10.1158/0008-5472.CAN-06-0515.

Gene expression signature in organized and growth-arrested mammary acini predicts good outcome in breast cancer

Affiliations

Gene expression signature in organized and growth-arrested mammary acini predicts good outcome in breast cancer

Marcia V Fournier et al. Cancer Res. .

Abstract

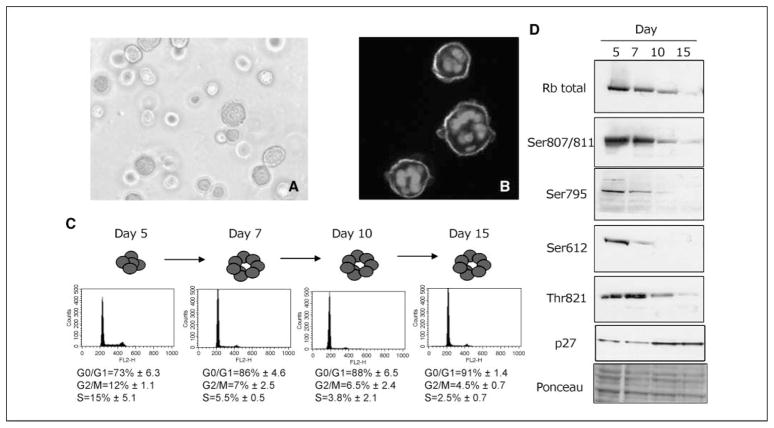
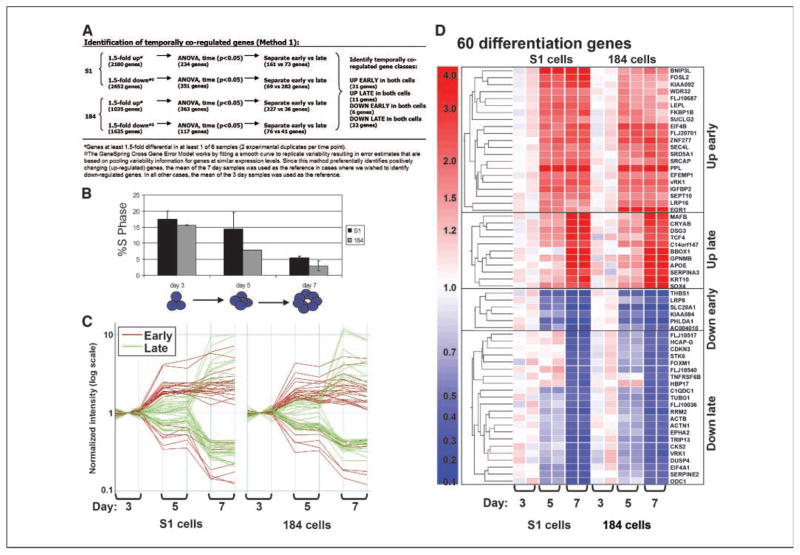
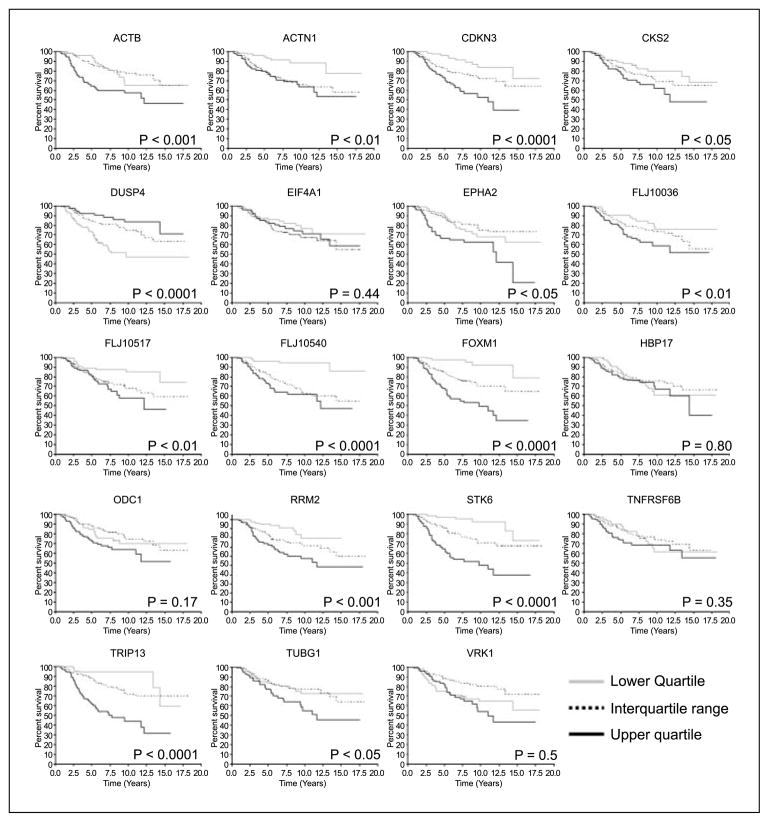
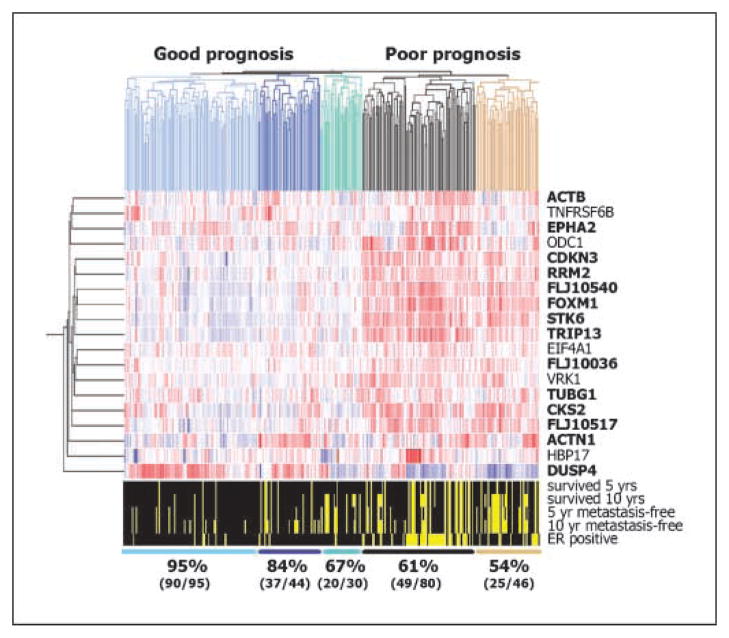
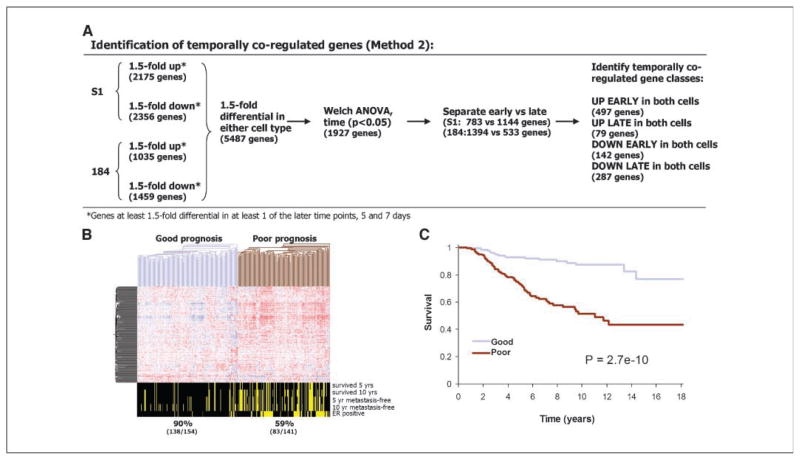
Nonmalignant human mammary epithelial cells (HMEC) seeded in laminin-rich extracellular matrix (lrECM) form polarized acini and, in doing so, transit from a disorganized proliferating state to an organized growth-arrested state. We hypothesized that the gene expression pattern of organized and growth-arrested HMECs would share similarities with breast tumors with good prognoses. Using Affymetrix HG-U133A microarrays, we analyzed the expression of 22,283 gene transcripts in 184 (finite life span) and HMT3522 S1 (immortal nonmalignant) HMECs on successive days after seeding in a lrECM assay. Both HMECs underwent growth arrest in G0-G1 and differentiated into polarized acini between days 5 and 7. We identified gene expression changes with the same temporal pattern in both lines and examined the expression of these genes in a previously published panel of microarray data for 295 breast cancer samples. We show that genes that are significantly lower in the organized, growth-arrested HMEC than in their proliferating counterparts can be used to classify breast cancer patients into poor and good prognosis groups with high accuracy. This study represents a novel unsupervised approach to identifying breast cancer markers that may be of use clinically.


Figures

Figure 1
Figure 1
HMEC cultured in lrECM form polarized structures and arrest growth in G0–G1. A, phase-contrast image of typical acinar structures formed by 184 cells at day 7 in lrECM. Structures reach dimensions of 20 to 40 μm diameter. Bar, 25 μm. B, indirect immunofluorescent image showing basal polarity of α6 integrin (green ) in 184 cells at day 7 in lrECM. Red, cell nuclei were stained with 4′,6-diamidino-2-phenylindole. C, flow cytometric analyses of propidium iodide–stained S1 cells indicated that the majority of the cells accumulated in the G0–G1 phase of the cell cycle by day 7 in lrECM. D, Western blot analyses of cell cycle regulatory molecules in S1 cells at days 5, 7, 10, and 15 after suspension in lrECM indicated that total as well as specific phosphorylated forms (Ser807/Ser811, Ser795, Ser612, and Thr821) of Rb decreased whereas p27 increased over the time course. Ponceau staining of major proteins indicated that equivalent amounts of total protein were loaded in each lane.
Figure 2
Figure 2
Temporally coregulated genes in HMEC grown in three-dimensional culture. A, temporal pattern of growth arrest in S1 and HMEC184 cells. The percentage of cells in S phase decreased significantly between days 3 and 7. B, scheme is provided outlining method 1 used to select sets of temporally coregulated genes. Sixty genes were determined by method 1 to show significant changes in expression in both HMEC specimens during the time course of incubation in lrECM. C, expression levels of the 60 genes that were coordinately expressed in both cell types. The genes were grouped into categories based on whether they showed coordinate up-regulation early by our definition (3–5 days), up-regulation late (5–7 days), down-regulation early, or down-regulation late during the time course (see text for details). Note that the scale is logarithmic. D, changes in the expression levels of the 60 individual genes are plotted and organized by hierarchical cluster analysis. Red, up-regulated genes; blue, down-regulated genes. Complete gene names and Genbank IDs are available (see Supplementary Data).
Figure 3
Figure 3
Fourteen of the 19 genes down-regulated late during acinar morphogenesis showed significant correlations with patient survival. Two hundred ninety-five patients were grouped into quartiles based on the relative expression of each selected gene in their corresponding tumors. Survival of each quartile was plotted according to the method of Kaplan-Meier. Ps, outcomes of the log-rank tests between the upper and lower quartiles.
Figure 4
Figure 4
The set of 19 genes down-regulated late during acinar morphogenesis can be used to accurately cluster 295 breast cancer samples into prognostic groups. Rows, relative expression levels of the genes (right); columns, individual patients. Scale of relative expression levels is the same as that in Fig. 2D. Genes and tumor samples were arranged by a hierarchical cluster analysis using a Pearson metric. Dendrograms, top, left, degree of relatedness of the samples and genes. Dendrogram branch colors, top, different prognostic groups. Bold font, genes were significantly associated with survival (P < 0.05, Kaplan-Meier analysis; Fig. 3). Bottom, clinical variables for the 295 patient samples. Black regions, a given variable applies to that patient.
Figure 5
Figure 5
A second set of 249 genes down-regulated late in the time course of HMECs in three-dimensional lrECM cultures classifies good versus poor prognosis in breast cancer patients. A, scheme outlining method 2 used to select sets of temporally coregulated genes. B, set of 249 down-regulated genes identified by method 2 clustered the 295 breast cancer samples into two prognostic groups. Genes are arranged by a hierarchical cluster analysis using a Pearson metric, and samples are arranged using a distance metric. Bottom, clinical variables. C, overall survival in the two groups was plotted by the method of Kaplan-Meier. P, outcome of the log-rank tests between the good and poor prognosis groups.

References

    1. Petersen OW, Ronnov-Jessen L, Howlett AR, Bissell MJ. Interaction with basement membrane serves to rapidly distinguish growth and differentiation pattern of normal and malignant human breast epithelial cells. Proc Natl Acad Sci U S A. 1992;89:9064–8. - PMC - PubMed
    1. Hammond SL, Ham RG, Stampfer MR. Serum-free growth of human mammary epithelial cells: rapid clonal growth in defined medium and extended serial passage with pituitary extract. Proc Natl Acad Sci U S A. 1984;81:5435–9. - PMC - PubMed
    1. Stampfer MR, Yaswen P. Culture systems for study of human mammary epithelial cell proliferation, differentiation, and transformation. Cancer Surv. 1993;18:7–34. - PubMed
    1. Briand P, Petersen OW, Van Deurs B. A new diploid nontumorigenic human breast epithelial cell line isolated and propagated in chemically defined medium. In Vitro Cell Dev Biol. 1987;23:181–8. - PubMed
    1. Hayes DF, Isaacs C, Stearns V. Prognostic factors in breast cancer: current and new predictors of metastasis. J Mammary Gland Biol Neoplasia. 2001;6:375–92. - PubMed

Publication types