. 2006 Nov 1;108(9):3179-86.
doi: 10.1182/blood-2005-12-010934. Epub 2006 Jul 18.

Short-chain fatty acids induce gamma-globin gene expression by displacement of a HDAC3-NCoR repressor complex

Affiliations

Short-chain fatty acids induce gamma-globin gene expression by displacement of a HDAC3-NCoR repressor complex

Rishikesh Mankidy et al. Blood. .

Abstract

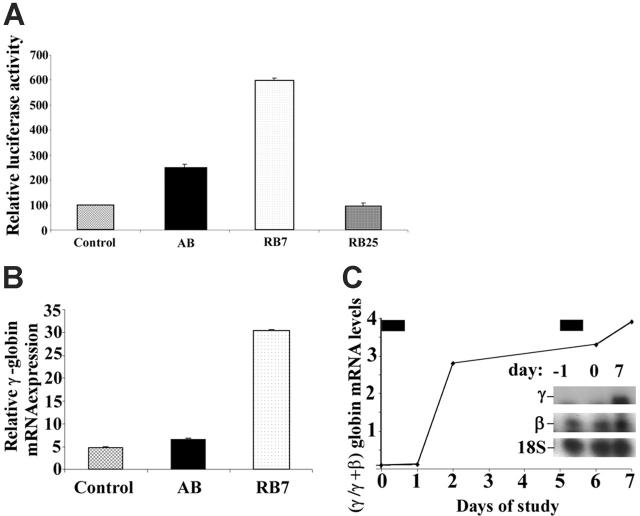
High-level induction of fetal (gamma) globin gene expression for therapy of beta-hemoglobinopathies likely requires local chromatin modification and dissociation of repressor complexes for gamma-globin promoter activation. A novel gamma-globin-inducing short-chain fatty acid derivative (SCFAD), RB7, which was identified through computational modeling, produced a 6-fold induction in a reporter assay that detects only strong inducers of the gamma-globin gene promoter and in cultured human erythroid progenitors. To elucidate the molecular mechanisms used by high-potency SCFADs, chromatin immunoprecipitation (ChIP) assays performed at the human gamma- and beta-globin gene promoters in GM979 cells and in erythroid progenitors demonstrate that RB7 and butyrate induce dissociation of HDAC3 (but not HDAC1 or HDAC2) and its adaptor protein NCoR, specifically from the gamma-globin gene promoter. A coincident and proportional recruitment of RNA polymerase II to the gamma-globin gene promoter was observed with exposure to these gamma-globin inducers. Knockdown of HDAC3 by siRNA induced transcription of the gamma-globin gene promoter, demonstrating that displacement of HDAC3 from the gamma-globin gene promoter by the SCFAD is sufficient to induce gamma-globin gene expression. These studies demonstrate new dynamic alterations in transcriptional regulatory complexes associated with SCFAD-induced activation of the gamma-globin gene and provide a specific molecular target for potential therapeutic intervention.


Figures

Figure 1.
Figure 1.
Relative induction of the γ-globin gene promoter by test compounds. (A) GM979 cells containing the integrated cassette (μLCRβprRlucAγprFluc) were assayed for luciferase activity. The ratio of firefly to renilla luciferase is shown for each compound tested: control, arginine butyrate (AB, 2500 μM), RB7 (200 μM), and RB25 (200 μM). Results are reported as relative induction and represent the mean of 4 experiments. Error bars indicate the standard errors of the mean. (B) γ-Globin mRNA induction in adult peripheral blood. Relative γ-globin mRNA expression levels (normalized to β-actin and G3PD transcripts) from cultured adult erythroid cells are shown in untreated control cells (C), or cells cultured with 100 μM arginine butyrate (AB) or 20 μM RB7. γ-Globin mRNA was induced 1.4-fold above control levels in cells cultured with AB, and 6.5-fold above control levels in cells treated with RB7. (C) Induction of fetal globin mRNA by RB7 treatment in an anemic baboon in vivo. Ratios of γ/γ+β-globin mRNA were induced by 2.8-fold and 4-fold above the animal's baseline level after 1 and 2 doses of RB7, respectively. The drug was administered on day 0 and day 5, as indicated by the solid bars above the graph. Insert shows baseline and on-treatment levels of γ-globin mRNA and 18S RNA.
Figure 2.
Figure 2.
In vitro HDAC assay. (A) In vitro assay of HDAC1, HDAC2, and HDAC3 isolated by immunoprecipitation from K562 cells. HDACs were assayed in the presence of control (C), AB (arginine butyrate, 2.5 mM), SAHA (suberoylanilide hydroxamic acid, 10 μM), BHA (butyryl hydroxamic acid, 2.5 mM), TSA (trichostatin A, 1 μM), ST-20 (1 mM), RB7 (200 μM), and RB25 (200 μM). For each enzyme assayed, the values represented are relative to the control reaction. Values are a mean of 3 independent experiments; error bars indicate the standard errors of the mean. (B) RB7 dose-response curve of immunoprecipitated HDAC1, HDAC2, and HDAC3 activity. Activity was assayed at RB7 concentrations of 10, 100, and 200 μM. Values reported are relative to the control reaction and are an average of 2 independent experiments.
Figure 3.
Figure 3.
Relative association of class I HDACs at the integrated β- and γ-globin gene promoters. Antibodies to HDAC1, HDAC2, and HDAC3 were used to immunoprecipitate chromatin isolated from GM979 cells cultured in either control conditions or 200 μM RB7. Precipitated DNA was amplified and quantitated by real-time PCR using primers flanking either the β-globin gene promoter (A) or the γ-globin gene promoter (B). For each HDAC antibody used, the presence of the HDAC protein bound at the promoter is represented relative to its control (arbitrarily set at 100). Data represent average of 3 independent experiments; error bars represent the standard error of the mean. (C) Agarose gel showing relative association of HDAC1, HDAC2, and HDAC3 with the beta- and gamma-globin promoters in GM979 cells cultured in either control conditions (C), or in the presence of 200 μM RB7 (R). Results are representative of 3 independent experiments. (Di) ChIP of NCoR at the γ-globin gene promoter. NCoR association with the human γ-globin gene promoter in control and RB7 (200 μM)–treated cells; values are reported relative to the control and are an average of 3 experiments. Error bar indicates standard error of the mean. (Dii) Dissociation of HDAC3/NCoR complex after RB7 treatment. Immunoprecipitation was carried out using HDAC3 antibodies. The immunoblot was performed using antibodies to HDAC3 and NCoR. Lane 1: control cells; lane 2: 200 μM RB7 treatment. (E) Acetylation status of β- and γ-globin gene promoters. Change in acetylation status of histones H3 and H4 at the β- and γ-globin gene promoter 24 hours after GM979 cells were treated with RB7. Values are represented as a percentage of the untreated control (C) and are an average of 3 independent experiments. Error bars represent the standard errors of the mean.
Figure 4.
Figure 4.
Chromatin immunoprecipitation and quantitative PCR of the integrated γ-globin gene promoter. GM979 cells were treated with active SCFADs (RB7 or AB) and an inactive SCFAD, RB25. Antibodies against HDAC3 (A) or RNA polymerase II (B) were used for chromatin IP. The results are following a 24-hour exposure to the drugs: control, RB7 (200 μM), arginine butyrate (2500 μM), and RB25 (200 μM). Values are an average of 3 independent experiments and are reported relative to the control. Error bars indicate the standard errors of the mean.
Figure 5.
Figure 5.
Relative expression of β-globin and γ-globin mRNA in human primary erythroid cells. (A) Globin mRNA analysis by RT-PCR. Cord blood erythroid progenitors were cultured either in control conditions, in the presence of AB (100 μM), or in the presence of RB7 (20 μM), and globin expression was assayed by RT-PCR. Values represent an average of 3 experiments, from independent cord blood specimens; error bars represent the standard errors of the mean. An increase in γ-globin mRNA, and corresponding decrease in the β-globin mRNA, was observed with SCFAD treatment compared with untreated controls. (B) Chromatin immunoprecipitation and quantitative PCR at the endogenous γ-globin gene promoter. Relative association of HDAC3 and RNA polymerase II at the γ-globin gene promoter in cord blood erythroid progenitors determined under control conditions, or with RB7 or AB treatment; error bars represent the standard errors of the mean. (C) Agarose gel showing relative association of HDAC3 and RNA polymerase II with the γ-globin promoter in cord blood erythroid progenitors cultured in either control conditions, AB (100 μM), or RB7 (20 μM). Results are representative of 3 independent experiments.
Figure 6.
Figure 6.
Knockdown of endogenous HDAC3 in GM979 cells. (Ai) RT-PCR analysis of HDAC3 mRNA levels 24 hours after transfection of the siRNA. (Top panel) HDAC3 levels. (Bottom panel) β-actin levels. Lane 1: control (nonspecific siRNA); lane 2: siHDAC3 (exon 8); lane 3: siHDAC3 (exon 9). (Aii) (Top panel) Immunoblot showing HDAC3 levels after cells were treated with siRNA. Lane 1: control (nonspecific siRNA); lane 2: siHDAC3 (exon 8), lane 3: siHDAC3 (exon 9). (Bottom panel) Immunoblot using β-actin as a loading control. (B) Relative induction of the Aγ-globin gene following siHDAC3 treatment. Ratios of firefly luciferase–renilla luciferase of cells treated with siHDAC3 (exons 8 and 9), represented as a percentage of the control transfection. Results shown were an average of 2 independent experiments and were recorded either at 24 hours (checked) or 48 hours (dotted) following siRNA treatment; error bars represent the standard errors of the mean.

Similar articles

Cited by

References

    1. Bank A. Regulation of human fetal hemoglobin: new players, new complexities. Blood. 2006;107: 435-443. - PMC - PubMed
    1. Stamatoyannopoulos G. Control of globin gene expression during development and erythroid differentiation. Exp Hematol. 2005;33: 259-271. - PMC - PubMed
    1. Peterson KR. Hemoglobin switching: new insights. Curr Opin Hematol. 2003;10: 123-129. - PubMed
    1. Li Q, Peterson KR, Fang X, Stamatoyannopoulos G. Locus control regions. Blood. 2002;100: 3077-3086. - PMC - PubMed
    1. Ryan TM, Sun CW, Ren J, Townes TM. Human gamma-globin gene promoter element regulates human beta-globin gene developmental specificity. Nucleic Acids Res. 2000;28: 2736-2740. - PMC - PubMed

Publication types

MeSH terms