

Optical molecular imaging for systems biology: from molecule to organism
- PMID: 16850295
- PMCID: PMC1592253
- DOI: 10.1007/s00216-006-0541-z
Optical molecular imaging for systems biology: from molecule to organism
Abstract
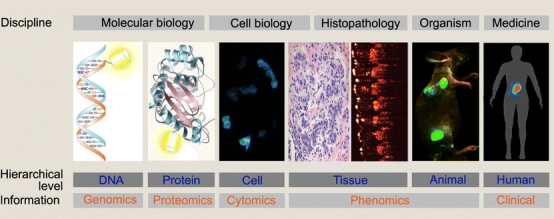
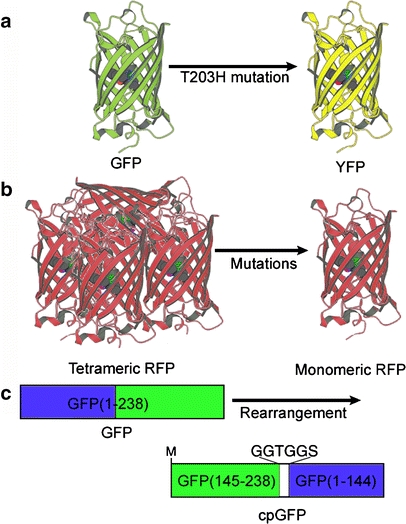
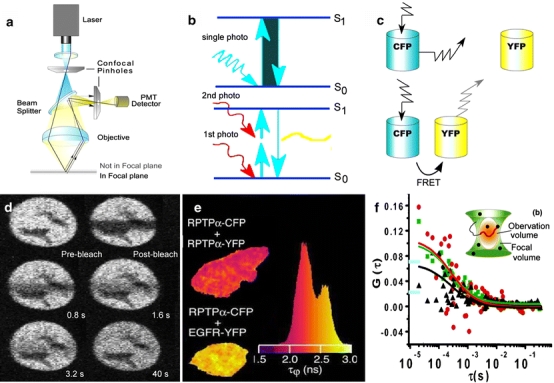
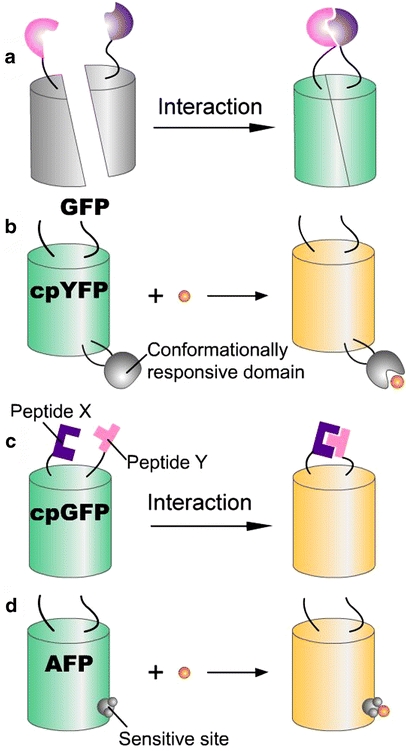
The development of highly efficient analytical methods capable of probing biological systems at system level is an important task that is required in order to meet the requirements of the emerging field of systems biology. Optical molecular imaging (OMI) is a very powerful tool for studying the temporal and spatial dynamics of specific biomolecules and their interactions in real time in vivo. In this article, recent advances in OMI are reviewed extensively, such as the development of molecular probes that make imaging brighter, more stable and more informative (e.g., FPs and semiconductor nanocrystals, also referred to as quantum dots), the development of imaging approaches that provide higher resolution and greater tissue penetration, and applications for measuring biological events from molecule to organism level, including gene expression, protein and subcellular compartment localization, protein activation and interaction, and low-mass molecule dynamics. These advances are of great significance in the field of biological science and could also be applied to disease diagnosis and pharmaceutical screening. Further developments in OMI for systems biology are also proposed.
Figures


Similar articles
-
Optical Probes for Neurobiological Sensing and Imaging.Acc Chem Res. 2018 May 15;51(5):1023-1032. doi: 10.1021/acs.accounts.7b00564. Epub 2018 Apr 13. Acc Chem Res. 2018. PMID: 29652127 Free PMC article. Review.
-
Engineering luminescent quantum dots for in vivo molecular and cellular imaging.Ann Biomed Eng. 2006 Jan;34(1):3-14. doi: 10.1007/s10439-005-9000-9. Epub 2006 Feb 1. Ann Biomed Eng. 2006. PMID: 16450199 Review.
-
Live-Cell Bioorthogonal Chemical Imaging: Stimulated Raman Scattering Microscopy of Vibrational Probes.Acc Chem Res. 2016 Aug 16;49(8):1494-502. doi: 10.1021/acs.accounts.6b00210. Epub 2016 Aug 3. Acc Chem Res. 2016. PMID: 27486796 Free PMC article. Review.
-
Quantum dots in biomedical applications.Acta Biomater. 2019 Aug;94:44-63. doi: 10.1016/j.actbio.2019.05.022. Epub 2019 May 11. Acta Biomater. 2019. PMID: 31082570 Free PMC article. Review.
-
Single molecule localization imaging of telomeres and centromeres using fluorescence in situ hybridization and semiconductor quantum dots.Nanotechnology. 2018 Jul 13;29(28):285602. doi: 10.1088/1361-6528/aabf72. Epub 2018 Apr 19. Nanotechnology. 2018. PMID: 29671751
Cited by
-
Quantum dot-induced epigenetic and genotoxic changes in human breast cancer cells.J Mol Med (Berl). 2008 Mar;86(3):291-302. doi: 10.1007/s00109-007-0274-2. Epub 2007 Oct 27. J Mol Med (Berl). 2008. PMID: 17965848
-
From superior contrast to super resolution label free optical microscopy.Npj Imaging. 2025 Jan 13;3(1):1. doi: 10.1038/s44303-024-00064-w. Npj Imaging. 2025. PMID: 40604121 Free PMC article. Review.
-
Bioinformatics in China: a personal perspective.PLoS Comput Biol. 2008 Apr 25;4(4):e1000020. doi: 10.1371/journal.pcbi.1000020. PLoS Comput Biol. 2008. PMID: 18437216 Free PMC article. Review. No abstract available.
-
Label-free optical imaging in developmental biology [Invited].Biomed Opt Express. 2020 Mar 13;11(4):2017-2040. doi: 10.1364/BOE.381359. eCollection 2020 Apr 1. Biomed Opt Express. 2020. PMID: 32341864 Free PMC article. Review.
-
Antibody-based imaging strategies for cancer.Cancer Metastasis Rev. 2014 Sep;33(2-3):809-22. doi: 10.1007/s10555-014-9505-5. Cancer Metastasis Rev. 2014. PMID: 24913898 Free PMC article. Review.
References
-
- Kitano H (ed) (2001) Foundations of systems biology. MIT Press, Cambridge, MA
-
- {'text': '', 'ref_index': 1, 'ids': [{'type': 'PubMed', 'value': '15907463', 'is_inner': True, 'url': 'https://pubmed.ncbi.nlm.nih.gov/15907463/'}]}
- Liu ET (2005) Cell 121:505–506 - PubMed
-
- {'text': '', 'ref_index': 1, 'ids': [{'type': 'PubMed', 'value': '11062431', 'is_inner': True, 'url': 'https://pubmed.ncbi.nlm.nih.gov/11062431/'}]}
- Palsson B (2000) Nat Biotechnol 18:1147–1150 - PubMed
-
- {'text': '', 'ref_index': 1, 'ids': [{'type': 'PubMed', 'value': '15470453', 'is_inner': True, 'url': 'https://pubmed.ncbi.nlm.nih.gov/15470453/'}]}
- Hood L, Perlmutter RM (2004) Nat Biotechnol 22:1215–1217 - PubMed
-
- {'text': '', 'ref_index': 1, 'ids': [{'type': 'PubMed', 'value': '11872829', 'is_inner': True, 'url': 'https://pubmed.ncbi.nlm.nih.gov/11872829/'}]}
- Kitano H (2002) Science 295:1662–1664 - PubMed
Publication types
MeSH terms
Substances
LinkOut - more resources
Full Text Sources
Miscellaneous
