Comparative Study
. 2006 Jul 21;2(7):e79.
doi: 10.1371/journal.pcbi.0020079. Epub 2006 May 18.

Protein-protein interactions more conserved within species than across species

Affiliations
Comparative Study

Protein-protein interactions more conserved within species than across species

Sven Mika et al. PLoS Comput Biol. .

Abstract

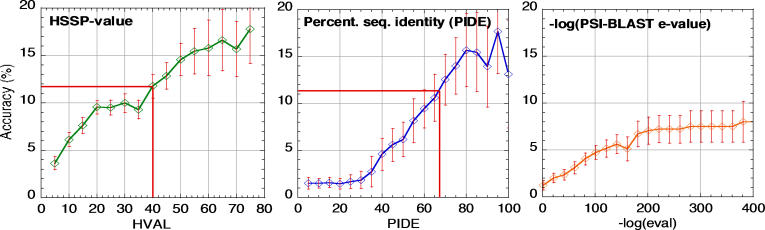
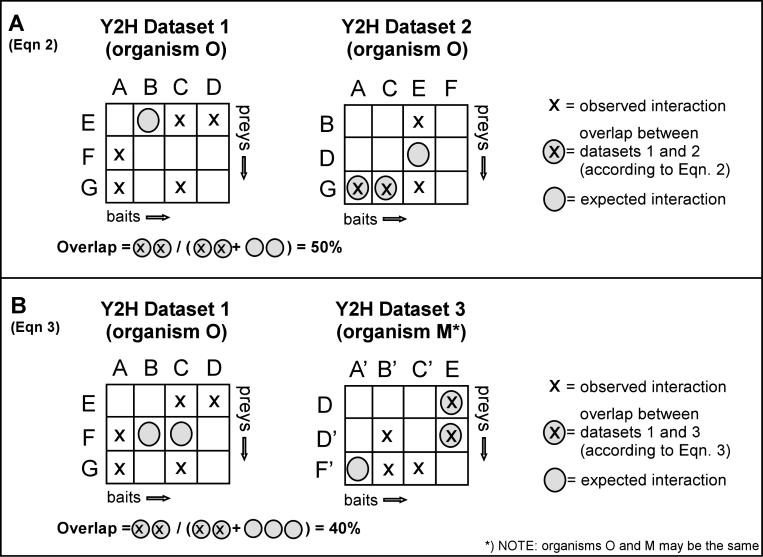
Experimental high-throughput studies of protein-protein interactions are beginning to provide enough data for comprehensive computational studies. Today, about ten large data sets, each with thousands of interacting pairs, coarsely sample the interactions in fly, human, worm, and yeast. Another about 55,000 pairs of interacting proteins have been identified by more careful, detailed biochemical experiments. Most interactions are experimentally observed in prokaryotes and simple eukaryotes; very few interactions are observed in higher eukaryotes such as mammals. It is commonly assumed that pathways in mammals can be inferred through homology to model organisms, e.g. the experimental observation that two yeast proteins interact is transferred to infer that the two corresponding proteins in human also interact. Two pairs for which the interaction is conserved are often described as interologs. The goal of this investigation was a large-scale comprehensive analysis of such inferences, i.e. of the evolutionary conservation of interologs. Here, we introduced a novel score for measuring the overlap between protein-protein interaction data sets. This measure appeared to reflect the overall quality of the data and was the basis for our two surprising results from our large-scale analysis. Firstly, homology-based inferences of physical protein-protein interactions appeared far less successful than expected. In fact, such inferences were accurate only for extremely high levels of sequence similarity. Secondly, and most surprisingly, the identification of interacting partners through sequence similarity was significantly more reliable for protein pairs within the same organism than for pairs between species. Our analysis underlined that the discrepancies between different datasets are large, even when using the same type of experiment on the same organism. This reality considerably constrains the power of homology-based transfer of interactions. In particular, the experimental probing of interactions in distant model organisms has to be undertaken with some caution. More comprehensive images of protein-protein networks will require the combination of many high-throughput methods, including in silico inferences and predictions. http://www.rostlab.org/results/2006/ppi_homology/


Conflict of interest statement

Competing interests. The authors have declared that no competing interests exist.

Figures

Figure 1
Figure 1. Concept of Homology Inference and Interologs
Interologs are two pairs of protein interactions that fulfill the following conditions: (A interacts with B) + (A is similar to A′) + (B is similar to B′) → (A′ interacts with B′). All quadruples (A, B, A′, B′) for which this relation is true are referred to as interologs [37,79]. To illustrate our analysis, we have to extend this simple relation. Assume that a physical protein–protein interaction (PPI) between proteins A and B is observed in organism o. If A and B are both sequence similar (above a certain threshold) to two other proteins A′ and B′ in the same organism o, we should be able to infer the physical interaction between A′ and B′. Note that both pairs, A/A′ as well as B/B′, have to be above the particular similarity threshold for us to be able to make this inference. Thus, we neither use an average similarity of both pairs (A/A′ and B/B′) nor a minimum similarity for just one pair (A/A′ or B/B′). Now let us assume that we have another pair of proteins A″ and B″ in another organism p, and that both are as similar to A and B as are A′ and B′, respectively. One of our findings was that homology transfers A-B → A′-B′ were more reliable than those from A-B → A″-B″.
Figure 2
Figure 2. Sequence Conservation of PPIs
The performance of homology transfer was evaluated with the data sets in Experiment 1 (Table 4). Each panel plots the conservation (accuracy of homology transfer) using a different measure for sequence similarity: HVAL (Equation 1), PIDE (percentage pairwise sequence identity), and the PSI-BLAST E-value. It is surprising that even at high similarity thresholds (PIDE > 50; HVAL > 30), accuracy remained low and never reached levels of 20%. This behavior was partially explained by our overlap analysis: for low overlap (Equations 2 and 3) between datasets, we expect a low accuracy. Numbers at HVAL = 40 (which equals a PIDE of 68 at an alignment length of 100 residues) were marked with red lines. HVAL = 40 is the point, where the overlap-values (Equation 3) for two identical datasets seem to indicate a zone of > 70% data consistency (see Table 3). Error bars for the three plots were calculated by bootstrapping over the PPIs in the source datasets (see Methods section).
Figure 3
Figure 3. Performance of Homology Transfer
Plots compiled for experiments 2–7 in Table 4. Each of the upper three graphs stands for one particular organism o and shows two plots: (1) Use all known PPIs (large-scale and small-scale) of organism o to find Y2H large-scale detected PPIs in the same organism (but from different experiment, blue line). (2) Use all PPIs (large-scale and small-scale) of all other organisms (not o) to find PPIs detected by Y2H in o (red line). Only organisms with available Y2H datasets in IntAct were chosen in order to be able to create complete interaction matrices for the target datasets (yeast, worm, and fruit fly). All error bars were calculated through bootstrapping over the source PPIs (100 times, Methods). Some lines end at certain thresholds because the counts for true positives and false positives were too low (< 30 true or false positives) to calculate accuracy (Equation 4, see Materials and Methods, often also referred to as specificity or precision). Figure S1 shows the correlation between the size of the error bars and the counts of true positives at each HSSP-value cutoff. The three bottom plots show ROC-like curves, where accuracy is plotted versus coverage for the exact same data as for the three upper plots. The figures demonstrate that for all levels of similarity, the accuracy of intraspecies predictions of PPIs is significantly higher than for predictions across two organisms.
Figure 4
Figure 4. Interspecies Failure and Intraspecies Success of Homology Transfer
(A) Same family, different ancestors, different PPI: Two yeast peroxisomal proteins (PEX1 and PEX2) are closely related through their common ancestor protein and their function as AAA ATPases to the two yeast 26S protease regulatory subunits 6A and 6B. In the fruit fly, gene duplication of a second ancestor protein (the NSF ancestor) led to two distinct NSF proteins (NSF1 and 2). Since the ancestors for the NSFs (NSF1 and 2) and for the 26S protease subunits were two different proteins, we conclude that despite their common biochemical function as ATPases, the different cellular functions of NSFs and 26S protease subunits also led to a distinct behavior with respect to protein–protein interactions. Therefore, neither NSF1 nor NSF2 were observed to bind to the 26S protease subunit 4. (B) Same pathway, different functions, different binding: Evolutionary plasticity in the chk2 family led to a diverse range of functions of these proteins while staying in the same pathway. For example Rad53p in yeast is a main player in the cell cycle checkpoint during mitosis, whereas Mek1p acts in the same position during meiosis. Also, drosophila chk2 and human chk2 act at different times during the cell cycle different from Mek1p and Rad53p. No drosophila Pp1 homolog in yeast was found to interact with either Mek1p or Rad53p, even though drosophila Pp1 was shown to bind to drosophila chk2.
Figure 5
Figure 5. Creating Sequence-Unique PPI sets
(1) Starting with a dataset of PPIs, we first cluster the data according to sequence similarity (apply a certain homology threshold) into sequence similar PPIs (2). Note here that the interactions A′-B′ and A′-C′ do not fall into the same cluster because B′ and C′ are unrelated. Thus, for two interactions (e.g., A-B and A′-B′) to be considered similar by our algorithm, both interacting proteins (A and B) have to be homologous to the two proteins of the other interaction (A has to be similar to A′ and B has to be similar to B′). (3) We randomly throw out all redundant interactions in each cluster so that only one PPI remains as a representative of each cluster. (4) Those representatives constitute the final unique dataset of PPIs.
Figure 6
Figure 6. Ways of Calculating the Overlap between Two Y2H Datasets
(A) Identity-based overlap between Datasets 1 and 2 according to Equation 2. Note that we can only calculate this score if both datasets are from the same organism. Starting with the observed interaction C-E in Dataset 1, we are trying to find the exact same interaction in Dataset 2. The following situations might occur: (a) C and E are also observed to interact in Dataset 2. (b) C and E are not observed to interact in Dataset 2. (c) It is impossible for C and E to be interacting in Dataset 2 due to either of these two reasons: (i) Either C or E are not part of Dataset 2 or (ii) C and E are either both used as preys or both used as baits in Dataset 2. Repeating the above procedure for all other observed interactions in Datasets 1 and 2, we finally calculate the identity-based overlap by dividing the number of common interactions found in Datasets 1 and 2 by the total number of expected interactions (observed and not-observed). (B) The same procedure as described above is applied to the two Datasets 1 and 3, which are now allowed to be from different organisms. The only difference to Equation 2 (A) is the usage of homology for comparing two PPIs instead of a binary decision scheme (PPIs identical or not-identical). Thus, starting with the interaction D-E from Dataset 1, we try to find possible homologous interactions (not only the identical PPI) in Dataset 3. The only two options in this example are D-E and D′-E (Dataset 3), which in our example are both observed in Dataset 3. Iterating through all observed interactions of Datasets 1 and 3 and summing up the expected interactions and the overlapping homologous interactions, we can then calculate the homology-based overlap (Equation 3). Note that any results from Equation 2 are not comparable to any results from Equation 3.
Figure 7
Figure 7. Evaluating Homology Inference of PPIs
Starting with the entirety of observed interactions in any organism o (Y2H plus small scale experiments), we first reduce the sequence redundancy from this dataset as described in Figure 3. Then we try to find homologs in the organism p for each of the unique PPIs of organism o. Since we want to be able to conclude that every nondetected interaction in organism p does actually not exist in real life, we need to have a complete interaction matrix (baits × preys) for organism p. Thus, we are forced to exclude all small-scale data from the organism p dataset and remain with a merger of all (redundant) Y2H interactions for this organism. For each interaction A-B from organism o, we can face any of the following situations: (a) A homologous interaction A′-B′ can be found in organism p, (b) no homologous interaction can be found in p, or (c) It is impossible to detect an interaction of type A′-B′ in p because of one of the following two reasons: (i) either A′ or B′ are missing in the dataset for p or (ii) Both A′ and B′ are either preys or both are baits in the dataset for organism p. The latter case (c.ii) is illustrated by the interaction E-F in organism o, which cannot be detected in organism p only because E′ and F′ are both used as preys in the experiment. No counts for false positives are made for those cases. Adding the numbers of true positives (expected and observed PPIs), false positives (expected but not observed) and false negatives (observed interaction only in organism p) allows us to calculate accuracy and coverage for each homology threshold used to infer interactions (Equation 4). It is important to note that in the case where o = p, comparisons between two identical experimental PPI-sets are ignored (e.g. A-B in o′s set “yeast-Ito-2001” is not used to predict A′-B′ in p′s set “yeast-Ito-2001”; o = p = yeast).

Similar articles

Cited by

References

    1. Fields S, Song O. A novel genetic system to detect protein–protein interactions. Nature. 1989;340:245–246. - PubMed
    1. Causier B. Studying the interactome with the yeast two-hybrid system and mass spectrometry. Mass Spectrom Rev. 2004;23:350–367. - PubMed
    1. Legrain P, Wojcik J, Gauthier JM. Protein–protein interaction maps: A lead towards cellular functions. Trends Genet. 2001;17:346–352. - PubMed
    1. Willats WG. Phage display: Practicalities and prospects. Plant Mol Biol. 2002;50:837–854. - PubMed
    1. Puig O, Caspary F, Rigaut G, Rutz B, Bouveret E, et al. The tandem affinity purification (TAP) method: A general procedure of protein complex purification. Methods. 2001;24:218–229. - PubMed

Publication types