. 2006 Jul 19:7:351.
doi: 10.1186/1471-2105-7-351.

MANET: tracing evolution of protein architecture in metabolic networks

Affiliations

MANET: tracing evolution of protein architecture in metabolic networks

Hee Shin Kim et al. BMC Bioinformatics. .

Abstract

Background: Cellular metabolism can be characterized by networks of enzymatic reactions and transport processes capable of supporting cellular life. Our aim is to find evolutionary patterns and processes embedded in the architecture and function of modern metabolism, using information derived from structural genomics.

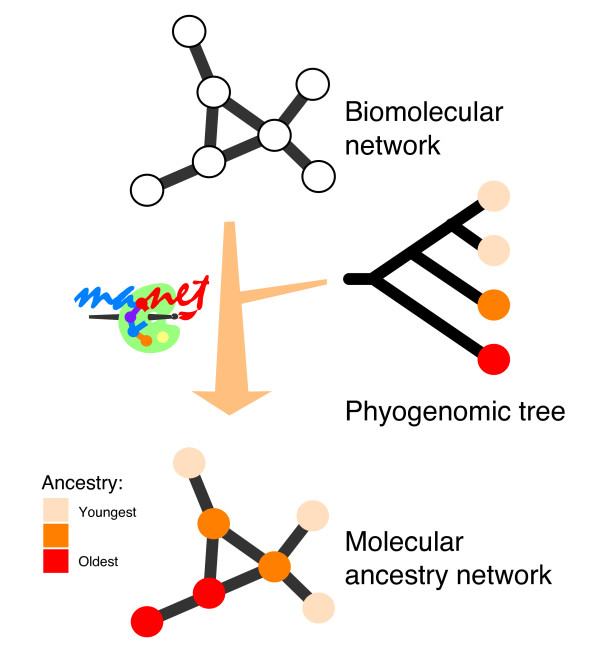
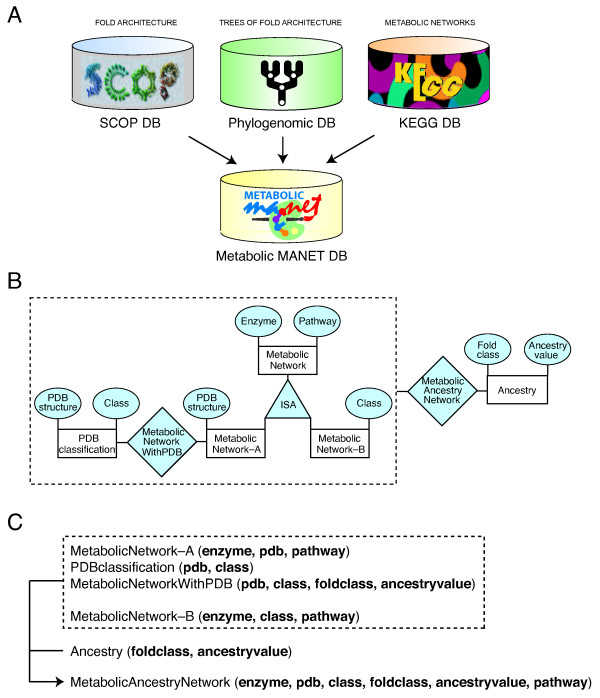
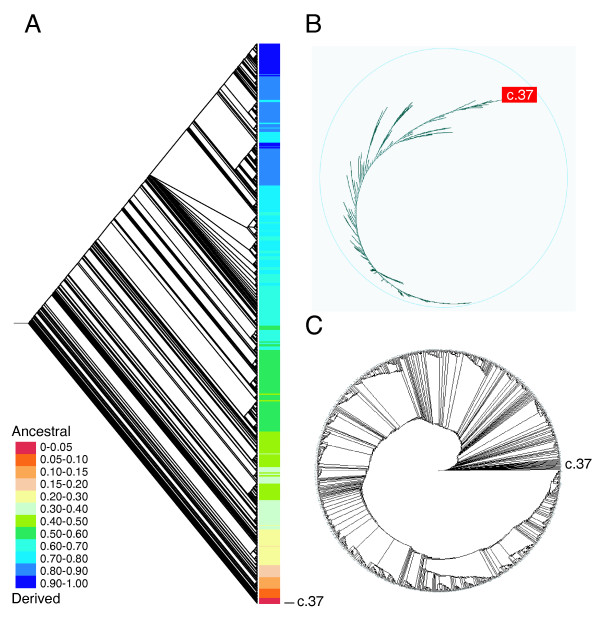
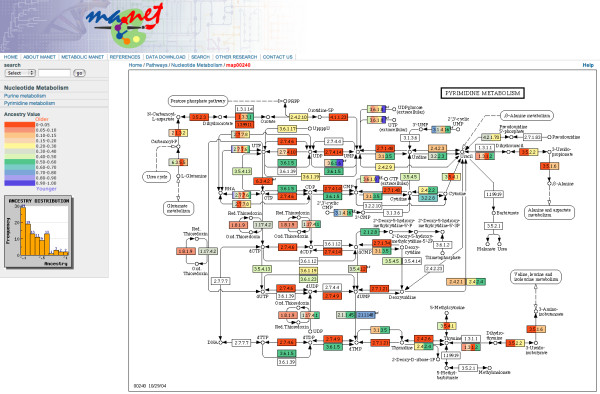
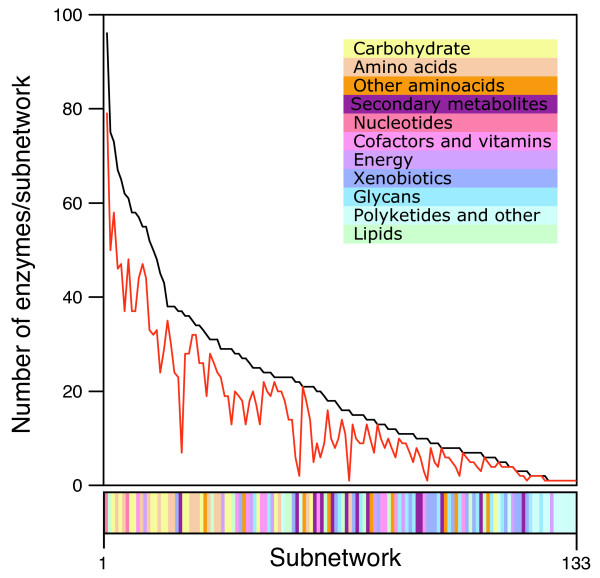
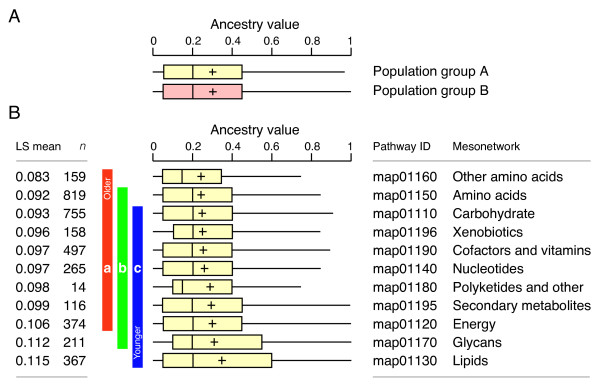
Description: The Molecular Ancestry Network (MANET) project traces evolution of protein architecture in biomolecular networks. We describe metabolic MANET, a database that links information in the Structural Classification of Proteins (SCOP), the Kyoto Encyclopedia of Genes and Genomes (KEGG), and phylogenetic reconstructions depicting the evolution of protein fold architecture. Metabolic MANET literally 'paints' the ancestries of enzymes derived from rooted phylogenomic trees directly onto over one hundred metabolic subnetworks, enabling the study of evolutionary patterns at global and local levels. An initial analysis of painted subnetworks reveals widespread enzymatic recruitment and an early origin of amino acid metabolism.

Conclusion: MANET maps evolutionary relationships directly and globally onto biological networks, and can generate and test hypotheses related to evolution of metabolism. We anticipate its use in the study of other networks, such as signaling and other protein-protein interaction networks.


Figures

Figure 1
Figure 1
The Molecular Ancestry Network (MANET). The MANET project traces evolutionary patterns derived from phylogenomic analysis along biomolecular networks. In one implementation of our method, we "paint" network nodes with a color scale that reflect their ancestries.
Figure 2
Figure 2
Principles of database design. A. The metabolic MANET database links the KEGG database, the SCOP database, and a database of phylogenomic trees of protein fold architecture. B. Entity-Relationship (ER) data model. "MetabolicAncestryNetwork" is the union of the relation "MetabolicNetworkwithPDB and Ancestry" and the relation "MetabolicNetwork-B and Ancestry". C. Relation schema for the ER model, specifying the name of each file and defining "MetabolicNetwork-A" and "MetabolicNetwork-B" (see Additional file 1).
Figure 3
Figure 3
Phylogenomic tree reconstruction of protein fold architecture generated from a domain census in 174 completely sequenced genomes. The structural census was defined by advanced HMMs and assigned domain structure to about 60% of genomic sequences. Three optimal trees of 115,818 steps were obtained after a heuristic search (CI = 0.134, RI = 0.696; RC = 0.093; g1 = -0.406; p < 0.01). The consensus phylogenomic tree is shown as a rooted dendrogram with terminals colored according to ranges of ancestry values (A), an unrooted hyperbolic tree (B), and a rooted circle tree (C). Terminal taxa are not labeled except for the fold of oldest origin, c.37, the P-loop hydrolase fold.
Figure 4
Figure 4
Representative subnetwork diagram describing molecular ancestries in metabolic MANET. A colored scale is use to assign binned ancestry values to enzyme nodes named with EC numbers. The red color represent enzyme nodes with the oldest ancestry (i.e. with ancestry values falling within the oldest range) and the blue color those of youngest ancestry. Some enzymes have more than one structural assignment. They are multidomain proteins or have different structures in different organisms. Colored enzymes with ancestry assignments resulting from HMM-based predictions are distinguished with a "sf" marking at the top right of rectangles depicting enzymatic nodes. Each subnetwork diagram also shows a frequency distribution plot of ancestries.
Figure 5
Figure 5
Painting efficiency in metabolic subnetworks. The plot describes the total number of enzymes (black line) and the total number of painted enzymes (red line) in each of the 132 subnetworks described in KEGG, sorted according to enzyme number. Subnetworks belonging to individual mesonetworks are identified with different colors.
Figure 6
Figure 6
Box-and-whiskers plot describing global frequency distribution profiles. A. Comparison of ancestry values derived from structural models using the join operation (population group A) and predicted using HMMs (population group B) in metabolic MANET. B. Statistical analysis of ancestry distribution in metabolic mesonetworks. Mesonetwork distributions next to vertical bars headed by the same letter are not significantly different (p < 0.05). The Least Squares (LS) means and number of enzymes analyzed (n) are given for each mesonetwork. Skeletal boxes describe median, lower and upper quartiles, and whiskers describe maximum and minimum values. Crosses indicate mean values.

References

    1. Rives AW, Galitski T. Modular organization of cellular networks. Proc Natl Acad Sci USA. 2003;100:1128–1133. doi: 10.1073/pnas.0237338100. - DOI - PMC - PubMed
    1. Ravasz E, Somera AL, Mongru DA, Oltvai ZN, Barabási A-L. Hierarchical organization of modularity in metabolic networks. Science. 2002;297:1551–1555. doi: 10.1126/science.1073374. - DOI - PubMed
    1. Gimera R, Amaral LAN. Functional cartography of complex metabolic networks. Nature. 2005;433:895–900. doi: 10.1038/nature03288. - DOI - PMC - PubMed
    1. Pfeiffer T, Soyer OS, Bonhoeffer S. The evolution of connectivity in metabolic networks. PLOS Biology. 2005;3:1269–1275. doi: 10.1371/journal.pbio.0030228. - DOI - PMC - PubMed
    1. Maden BEH. No soup for starters? Autotrophy and the origins of metabolism. Trends Biochem Sci. 1995;20:337–341. doi: 10.1016/S0968-0004(00)89069-6. - DOI - PubMed

Publication types

MeSH terms

LinkOut - more resources