

Identification of biofilm proteins in non-typeable Haemophilus Influenzae
- PMID: 16854240
- PMCID: PMC1559630
- DOI: 10.1186/1471-2180-6-65
Identification of biofilm proteins in non-typeable Haemophilus Influenzae
Erratum in
- BMC Microbiol. 2013;13:261
Abstract
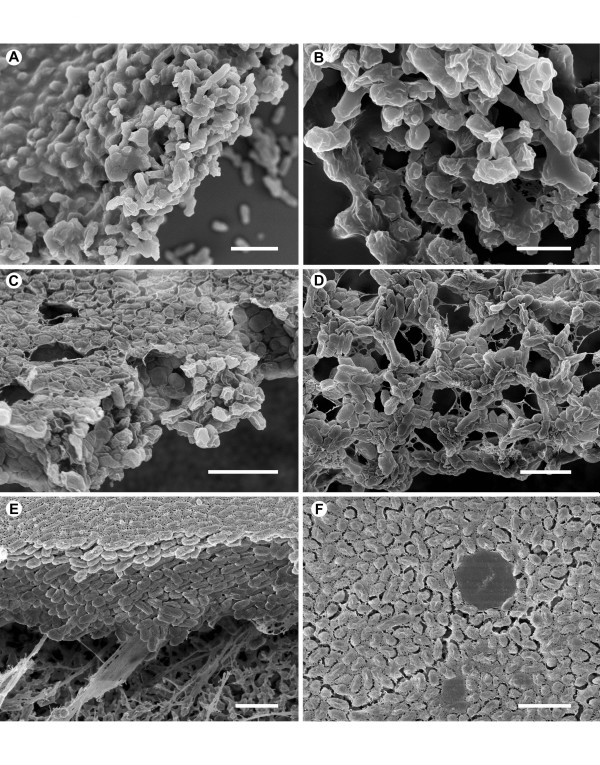
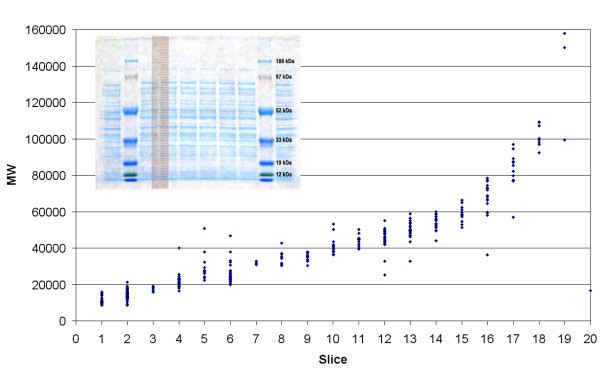
Background: Non-typeable Haemophilus influenzae biofilm formation is implicated in a number of chronic infections including otitis media, sinusitis and bronchitis. Biofilm structure includes cells and secreted extracellular matrix that is "slimy" and believed to contribute to the antibiotic resistant properties of biofilm bacteria. Components of biofilm extracellular matrix are largely unknown. In order to identify such biofilm proteins an ex-vivo biofilm of a non-typeable Haemophilus influenzae isolate, originally from an otitis media patent, was produced by on-filter growth. Extracellular matrix fraction was subjected to proteomic analysis via LC-MS/MS to identify proteins.
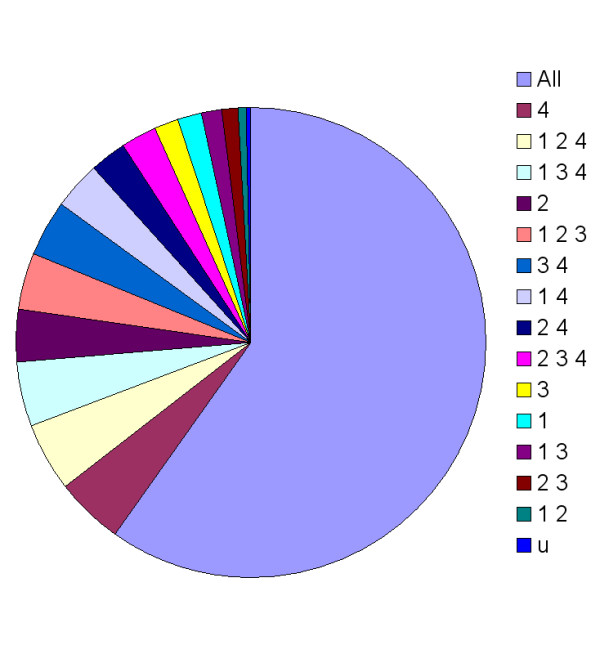
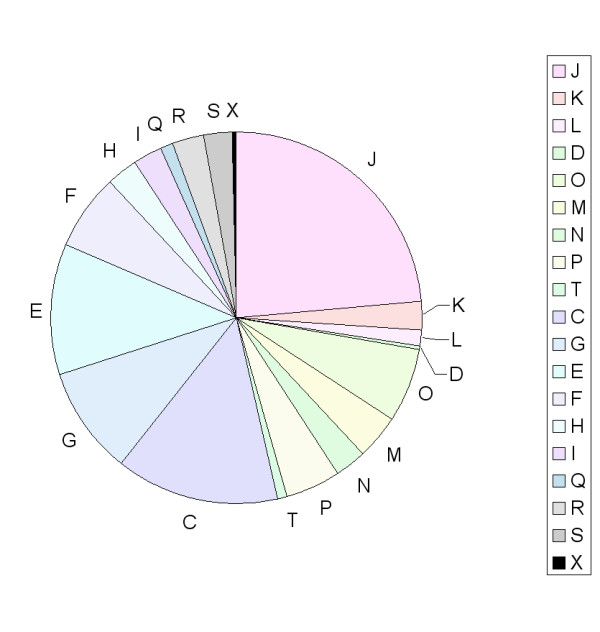
Results: 265 proteins were identified in the extracellular matrix sample. The identified proteins were analyzed for COG grouping and predicted cellular location via the TMHMM and SignalP predictive algorithms. The most over-represented COG groups identified compared to their frequency in the Haemophilus influenzae genome were cell motility and secretion (group N) followed by ribosomal proteins of group J. A number of hypothetical or un-characterized proteins were observed, as well as proteins previously implicated in biofilm function.
Conclusion: This study represents an initial approach to identifying and cataloguing numerous proteins associated with biofilm structure. The approach can be applied to biofilms of other bacteria to look for commonalities of expression and obtained information on biofilm protein expression can be used in multidisciplinary approaches to further understand biofilm structure and function.
Figures
Similar articles
-
Distribution of bacterial proteins in biofilms formed by non-typeable Haemophilus influenzae.J Histochem Cytochem. 2006 Jul;54(7):829-42. doi: 10.1369/jhc.6A6922.2006. Epub 2006 Mar 20. J Histochem Cytochem. 2006. PMID: 16549506
-
Phosphorylcholine expression by nontypeable Haemophilus influenzae correlates with maturation of biofilm communities in vitro and in vivo.J Bacteriol. 2007 Nov;189(22):8300-7. doi: 10.1128/JB.00532-07. Epub 2007 Jun 15. J Bacteriol. 2007. PMID: 17573475 Free PMC article.
-
Haemophilus influenzae luxS mutants form a biofilm and have increased virulence.Microb Pathog. 2005 Sep;39(3):87-96. doi: 10.1016/j.micpath.2005.06.003. Microb Pathog. 2005. PMID: 16099134
-
Novel concepts in nontypeable Haemophilus influenzae biofilm formation.FEMS Microbiol Lett. 2013 Sep;346(2):81-9. doi: 10.1111/1574-6968.12203. Epub 2013 Jul 15. FEMS Microbiol Lett. 2013. PMID: 23808954 Review.
-
Nontypeable Haemophilus influenzae as a pathogen in children.Pediatr Infect Dis J. 2009 Jan;28(1):43-8. doi: 10.1097/INF.0b013e318184dba2. Pediatr Infect Dis J. 2009. PMID: 19057458 Review.
Cited by
-
Kinetic analysis and evaluation of the mechanisms involved in the resolution of experimental nontypeable Haemophilus influenzae-induced otitis media after transcutaneous immunization.Vaccine. 2013 Jul 25;31(34):3417-26. doi: 10.1016/j.vaccine.2012.10.033. Epub 2012 Oct 22. Vaccine. 2013. PMID: 23092856 Free PMC article.
-
Identification of Cross Reactive Antigens of C. botulinum Types A, B, E & F by Immunoproteomic Approach.Curr Microbiol. 2018 May;75(5):531-540. doi: 10.1007/s00284-017-1413-9. Epub 2018 Jan 13. Curr Microbiol. 2018. PMID: 29332140
-
The Description and Analysis of the Complete Genome of Dermacoccus barathri FBCC-B549 Strain.Microorganisms. 2024 Jun 18;12(6):1227. doi: 10.3390/microorganisms12061227. Microorganisms. 2024. PMID: 38930609 Free PMC article.
-
Characterization of protein factor(s) in rat bronchoalveolar lavage fluid that enhance insulin transport via transcytosis across primary rat alveolar epithelial cell monolayers.Eur J Pharm Biopharm. 2008 Aug;69(3):808-16. doi: 10.1016/j.ejpb.2008.01.028. Epub 2008 Feb 6. Eur J Pharm Biopharm. 2008. PMID: 18406118 Free PMC article.
-
Biofilm-specific extracellular matrix proteins of nontypeable Haemophilus influenzae.Pathog Dis. 2014 Dec;72(3):143-60. doi: 10.1111/2049-632X.12195. Epub 2014 Jul 10. Pathog Dis. 2014. PMID: 24942343 Free PMC article.
References
-
- Walters MC, 3, Roe F, Bugnicourt A, Franklin MJ, Stewart PS. Contributions of antibiotic penetration, oxygen limitation, and low metabolic activity to tolerance of Pseudomonas aeruginosa biofilms to ciprofloxacin and tobramycin. Antimicrob Agents Chemother. 2003;47:317–23. doi: 10.1128/AAC.47.1.317-323.2003. - DOI - PMC - PubMed
Publication types
MeSH terms
Substances
LinkOut - more resources
Full Text Sources
Other Literature Sources
