. 2006 Oct;17(10):4270-81.
doi: 10.1091/mbc.e05-12-1098. Epub 2006 Jul 19.

Organization of the integrin LFA-1 in nanoclusters regulates its activity

Affiliations

Organization of the integrin LFA-1 in nanoclusters regulates its activity

Alessandra Cambi et al. Mol Biol Cell. 2006 Oct.

Abstract

The beta2-integrin LFA-1 facilitates extravasation of monocytes (MOs) into the underlying tissues, where MOs can differentiate into dendritic cells (DCs). Although DCs express LFA-1, unlike MOs, they cannot bind to ICAM-1. We hypothesized that an altered integrin organization on the DC plasma membrane might cause this effect and investigated the relationship between membrane organization and function of LFA-1 on MOs and DCs. High-resolution mapping of LFA-1 surface distribution revealed that on MOs LFA-1 function is associated with a distribution in well-defined nanoclusters (100-150-nm diameter). Interestingly, a fraction of these nanoclusters contains primed LFA-1 molecules expressing the specific activation-dependent L16-epitope. Live imaging of MO-T-cell conjugates showed that only these primed nanoclusters are dynamically recruited to the cellular interface forming micrometer-sized assemblies engaged in ligand binding and linked to talin. We conclude that besides affinity regulation, LFA-1 function is controlled by at least three different avidity patterns: random distributed inactive molecules, well-defined ligand-independent proactive nanoclusters, and ligand-triggered micrometer-sized macroclusters.


Figures
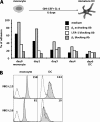
Figure 1.
Figure 1.
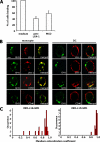
Binding to ICAM-1 and L16 epitope expression decrease during development of moDCs. (A) Adhesion to ICAM-1 during development of moDCs (see drawing) was determined using 1-μm ligand-coated fluorescent beads, prepared as described in Materials and Methods. NKI-L15 and NKI-L19 mAbs were used to block LFA-1 and all β2 integrins, respectively. To enhance binding, the anti-β2 activating mAb KIM185 was used. Neither blocking nor activation was observed in presence of isotype controls (unpublished data). One representative experiments out of three is shown. (B) The expression levels of LFA-1 on MOs and DCs were assessed by FACS analysis. □, the isotype control; ▩, the specific staining with anti-LFA-1 mAb. Mean fluorescence intensity is indicated. One representative donor is shown.
Figure 2.
Figure 2.
LFA-1 resides in lipid rafts on MOs, not on DCs. (A) LFA-1–mediated adhesion to ICAM-1–coated beads was measured on MOs after cholesterol depletion by preincubation with 20 mM MCD for 30 min at 37°C. Data shown are means ± SD of one representative experiment (out of three) performed in triplicate. (B) Confocal microscopy analysis of copatching of LFA-1 (NKI-L15 labeled) and GM1 on MOs and DCs. Receptor copatching and staining were performed as described in Material and Methods. CD55 and CD46 are positive and negative lipid rafts marker, respectively. Results are representatives of multiple cells in three independent experiments. Bar, 5 μm. (C) To quantify the degree of colocalization between either NKI-L15 (total LFA-1) or NKI-L16 (primed LFA-1) with GM1 on MOs, the Manders coefficient (M1) was calculated. M1 can vary between 0 and 1 (1 = colocalization). Receptor copatching and staining were performed as described in Material and Methods, and cells were analyzed by confocal microscopy (n = 22).
Figure 3.
Figure 3.
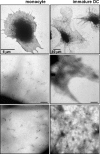
LFA-1 is clustered on MOs and random on DCs. MOs and DCs were specifically labeled with 10-nm gold and treated for TEM (see Materials and Methods). Results represent multiple cells in several independent experiments. The top pictures represent whole cells imaged by TEM. Middle and bottom pictures are higher magnifications where 10-nm gold particles are visible. Bar, 200 nm unless otherwise indicated.
Figure 4.
Figure 4.
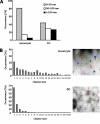
Quantitative analysis of the distribution of gold particles labeling LFA-1. The digital images were processed by a custom-written software based on Labview. Gold labels were counted, and coordinates were assigned to each feature. Interparticle distances were calculated using a nearest neighbor (nn) distance algorithm. (A) nn distance values were calculated for each image, and the data of several independent experiments were pooled. Subsequently, the nn distances were divided into three classes: 0–50, 50–100, and >100 nm, and the percentage of nn distance values falling into each class was plotted. (B) The partitioning of gold labels in clusters of various size (i.e., number of particles/cluster) was also quantified. Clusters were defined when gold particles were <50 nm apart from a neighboring particle. The percentage of gold particles involved in the formation of a certain cluster size was calculated. The insets are two representative processed digital images, where each type of cluster is shown in a different color. One representative experiment out of three is shown.
Figure 5.
Figure 5.
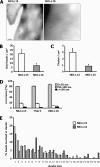
Resting and primed ligand-independent LFA-1 nanoclusters are expressed on the MO plasma membrane. (A) MOs were labeled as described in Figure 4, and the distribution patterns obtained with different anti-αL mAbs were compared. (B) Quantitative analysis of the distribution of gold particle labeling LFA-1 was performed as described in Figure 4B, and gold labels detected per μm2 were counted. (C) Also, the number of clusters per μm2 was calculated. (D) The percentage of nn distance values falling into each class was plotted. Data are the mean of three independent experiments ±SD. (E) The partitioning of gold labels in clusters of various size was also quantified and compared between the mAbs. Clusters were defined as described in Figure 4B. One representative experiment out of three is shown. Scale bar, 200 nm.
Figure 6.
Figure 6.
The primed LFA-1 molecules colocalize with ICAM-1 and talin at the cell–cell contacts. (A) MOs were allowed to adhere onto PLL-coated glass coverslips for 30 min at 37°C. After extensive washing with cold PBS, cells were incubated with TS2/4 (red) and NKI-L16 (green) on ice for 30 min to label total LFA-1 and primed LFA-1, respectively. Unbound Abs were removed, and cells were fixed with 2% PFA. Isotype specific Alexa-conjugated goat anti-mouse Abs were added. The cells were analyzed by confocal microscopy, and colocalization is indicated in yellow. (B) MOs were seeded at high density on PLL-coated glass coverslips and labeled as described for A. Total LFA-1 is shown in green and primed fraction in red. Colocalization is indicated in yellow in the merged picture. Subsequently, triple labeling for total LFA-1 (green), primed LFA-1 (blue), and various interactors (red), such as the ligand ICAM-1 (C), talin (D), cytohesin-1 (E), and RapL (F), was performed on high-density seeded MOs. Colocalization is shown in the merged pictures. Bar, 10 μm, unless otherwise indicated.
Figure 7.
Figure 7.
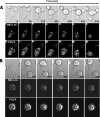
The primed LFA-1 nanoclusters are rapidly recruited at the MO–T-cell contact. (A) MOs were allowed to adhere at low density onto a glass coverslip for 30 min at 37°C. After washing with PBS, MOs were labeled with anti-aL mAbs NKI-L16 and TS2/4, as described in Materials and Methods. After removal of unbound Abs, Jurkat T-cells were added. The formation of spontaneous conjugates between MOs and T-cells was followed at 37°C with a Zeiss LSM 510 microscope. (B) In presence of the blocking mAb NKI-L15, the number of conjugates was lower, and no enrichment of NKI-L16–positive LFA-1 molecules at the cell–cell contact was observed.
Figure 8.
Figure 8.
Quantification of the recruitment of the primed LFA-1 fraction at the MO–T-cell contact site. As shown in the cartoon, the recruitment index (RI) of each Ab was defined as the fluorescence intensity at the contact site divided by the fluorescence intensity of the whole cell. Data in A and B are referred to the images shown in Figure 7, A and B, respectively, and are representative of multiple cells in three independent experiments.
Figure 9.
Figure 9.
Major changes in LFA-1 avidity and adhesiveness occur during DC development. This cartoon summarizes the major phenotypical changes observed on DCs compared with their precursor MO. Although on immature DCs, LFA-1 is unable to bind to its ligands, is randomly distributed at the cell surface and completely excluded from the lipid rafts, on MO LFA-1 is organized in well- defined submicrometer sized nanoclusters. LFA-1 nanoclusters reside in lipid rafts but differ in terms of activation state: a fraction is primed and express the L16 epitope, the rest is in a bent resting conformation. By interaction with ICAM-1–bearing cells, the primed nanoclusters are recruited at the contact site, generating micrometer-sized macroclusters. There, LFA-1 binds to the counterreceptor ICAM-1 and establishes additional interactions with the cytoplasmic protein talin. In cell types other than MO, other regulators, such as RapL, might be then recruited from the cytoplasm and further strengthen binding and modulate signaling.

References

    1. Banchereau J., Steinman R. M. Dendritic cells and the control of immunity. Nature. 1998;392:245–252. - PubMed
    1. Bazzoni G., Hemler M. E. Are changes in integrin affinity and conformation overemphasized? Trends Biochem. Sci. 1998;23:30–34. - PubMed
    1. Beals C. R., Edwards A. C., Gottschalk R. J., Kuijpers T. W., Staunton D. E. CD18 activation epitopes induced by leukocyte activation. J. Immunol. 2001;167:6113–6122. - PubMed
    1. Beglova N., Blacklow S. C., Takagi J., Springer T. A. Cysteine-rich module structure reveals a fulcrum for integrin rearrangement upon activation. Nat. Struct. Biol. 2002;9:282–287. - PubMed
    1. Bounou S., Giguere J. F., Cantin R., Gilbert C., Imbeault M., Martin G., Tremblay M. J. The importance of virus-associated host ICAM-1 in human immunodeficiency virus type 1 dissemination depends on the cellular context. FASEB J. 2004;18:1294–1296. - PubMed

Publication types

MeSH terms

Substances

LinkOut - more resources