. 2006 Jul 19;26(29):7665-73.
doi: 10.1523/JNEUROSCI.0444-06.2006.

Beta1-integrin signaling mediates premyelinating oligodendrocyte survival but is not required for CNS myelination and remyelination

Affiliations

Beta1-integrin signaling mediates premyelinating oligodendrocyte survival but is not required for CNS myelination and remyelination

Yves Benninger et al. J Neurosci. .

Abstract

Previous reports, including transplantation experiments using dominant-negative inhibition of beta1-integrin signaling in oligodendrocyte progenitor cells, suggested that beta1-integrin signaling is required for myelination. Here, we test this hypothesis using conditional ablation of the beta1-integrin gene in oligodendroglial cells during the development of the CNS. This approach allowed us to study oligodendroglial beta1-integrin signaling in the physiological environment of the CNS, circumventing the potential drawbacks of a dominant-negative approach. We found that beta1-integrin signaling has a much more limited role than previously expected. Although it was involved in stage-specific oligodendrocyte cell survival, beta1-integrin signaling was not required for axon ensheathment and myelination per se. We also found that, in the spinal cord, remyelination occurred normally in the absence of beta1-integrin. We conclude that, although beta1-integrin may still contribute to other aspects of oligodendrocyte biology, it is not essential for myelination and remyelination in the CNS.


Figures

Figure 1.
Figure 1.
Cre-mediated recombination of the β1-integrin gene leads to loss of β1-integrin in OPCs. Schematic representation of the CNPase-Cre knock-in allele (A) and the floxed β1-integrin allele (B). In the conditional β1-integrin allele, two loxP sites (black triangles) flank exons 2–7. During CNPase-Cre-mediated recombination, this genomic region is excised, generating a null allele. The presence of a promoterless lacZ gene trailing the conditional allele and containing a splice acceptor derived from the intron upstream of exon 2 ensures that, after recombination, the oligodendroglial cells will express β-gal under the control of the β1-integrin promoter. Western blot analysis demonstrate that β1-integrin levels in mutant P14 optic nerves (C) and in freshly purified OPCs obtained from mutant P0 mice mixed glial cultures (D) are strongly reduced compared with those of controls. E, Double immunostaining for β1-integrin and the oligodendrocyte precursor marker NG2 show loss of β1-integrin immunoreactivity on E19.5-derived spinal cord NG2-positive mutant cells (arrowheads) but not in their control counterparts (arrows). NG-2 negative cells are β1-integrin positive (white arrowheads). In <10% of NG2-positive cells, some remaining β1-integrin immunoreactivity was observed (arrows in Ec–Ec″). Scale bars, 50 μm.
Figure 2.
Figure 2.
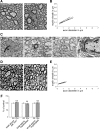
Normal myelination in the optic nerve and corpus callosum in the absence of β1-integrin. A, D, Representative EM pictures of myelinated fibers in cross sections of the optic nerve and corpus callosum of 2-month-old control and mutant mice. The myelin sheaths within mutant optic nerve (A) and corpus callosum (D) show no signs of dysmyelination. The linear regression of the fiber measurements performed for each animal is shown for the optic nerve (B) and for the corpus callosum (E), dashed lines representing mutants. Neither in the optic nerve nor in the corpus callosum were the linear regressions from controls (co) and mutants (mu) significantly different (optic nerve, p = 0.37; corpus callosum, p = 0.88). C, Bluogal electron microscopy of mutant optic nerves showing precipitates in the soma of an oligodendrocyte (arrowhead in Ca) and in the myelin sheath inner loop of mature fibers (asterisks in Cb–Cd). Cd, Higher-magnification image of inset in Cc showing Bluogal precipitates in the inner loop (arrowheads) of the myelin sheath (arrows). The total number of axons, myelinated axons, and small myelinated axons (axon diameter <0.5 μm) were counted in 10 randomly selected nonoverlapping fields from midsagittal sections through the corpus callosum just above the fornix. The total number of axons, myelinated axons, and small myelinated axons per unit area are presented as percentages of control. No significant differences were found in all three categories. Scale bars: A, Ca–Cc, D, 1 μm; Cd, 0.5 μm.
Figure 3.
Figure 3.
Normal myelination in the developing spinal cord in the absence of β1-integrin. A, C, Representative EM pictures of myelinated fibers in cross sections of the spinal cord of 3-month-old and 5-d-old control and mutant mice. The linear regression of the fiber measurements performed for each animal is shown for the spinal cord of 3-month-old mice. B, Dashed lines represent mutants. No significant differences were found (p = 0.61). D, MBP immunohistochemistry performed on cross sections of thoracic spinal cord of 5-d-old control and mutant mice. No significant differences were found in MBP-positive areas in control and mutant spinal cords (p = 0.56). E, In 3-week-old mutant spinal cord, the proportion of recombined [i.e., Bluogal (Bgal)-positive] oligodendrocytes was compared with the number of all CC1-positive oligodendrocytes. Bluogal/CC1 double-positive oligodendrocytes (black arrows) and a CC1 single-positive oligodendrocyte (white arrow) are shown. Of all counted CC1-positive cells, 89% were also Bluogal positive. F, The frequency of recombined, i.e., Bluogal positive, oligodendrocytes in 3-week-old control and mutant spinal cords were analyzed, and the numbers were not significantly different (p = 0.94). Scale bars: A, 1 μm; C, 5 μm; D, 200 μm; E, 20 μm; F, 50 μm.
Figure 4.
Figure 4.
β1-integrin expression is not required for spinal cord remyelination. A, The focal demyelination was induced by the injection of the membrane solubilizer lysolecithin into the dorsal funiculus of the spinal cord. B, Representative EM pictures showing cross sections of remyelinated fibers 5 weeks after lysolecithin-induced demyelination. The myelin sheaths in the mutants show no signs of dysmyelination. C, The graphic represents the linear regressions of fiber measurements for each animal within the remyelinated lesion. The dashed lines represent mutants. The linear regressions from control and mutant animals were not significantly different (4 controls, 5 mutants; p = 0.38). D, The ratio of remyelinated and demyelinated fibers is presented as percentage of the total number of fibers. There is no significant difference (p = 0.54; n = 4) in the percentage of remyelinated fibers between control (97 ± 1.6%) and mutant (98 ± 1.4%) lesions. The extent of remyelination was assessed by counting at least 350 fibers within control and mutant lesions. E, X-gal stainings in control and mutant lesioned spinal cords 8 d and 4 weeks after lysolecithin injection. At 8 d, both control and mutant lesions display a diffuse and faint staining, probably reflecting the degraded oligodendrocytes. At 4 weeks after injection of lysolecithin, both control and mutant lesions show a very prominent staining pattern, which reflects the accumulation of recombined remyelinating cells. This indicates that a significant contribution of non-recombined cells is unlikely to explain the normal remyelination in the mutant lesion. gm, Gray matter; wm, white matter. Scale bars: B, 1 μm; E, 100 μm. Results are expressed as the mean ± SD.
Figure 5.
Figure 5.
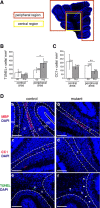
Increased apoptosis of premyelinating oligodendrocytes in the cerebellum of mutant mice. A, Overview of a sagittally sectioned P5 cerebellum (DAPI stained). Indicated are the analyzed central and peripheral regions. B, In the fiber tracts of the central area of the cerebellum, the number of TUNEL-positive cells in control (co) (121 ± 86/mm2) and mutant (mu) (83 ± 19/mm2) mice is not significantly different (p = 0.345; n = 4). C, The same is true (n = 4; p = 0.153) for the number of control (211 ± 95/mm2) and mutant (146 ± 29/mm2) CC1-positive cells. In contrast, in the fiber tracts of the peripheral lobar areas of the cerebellum, the number of both TUNEL- and CC1-positive cells is significantly different (B, C). In these areas, the number of TUNEL-positive cells is significantly higher (p = 0.038; n = 4) in the mutant (340 ± 105/mm2) than in control (185 ± 61/mm2) cerebella and, in the case of CC1-positive cells, significantly lower (p = 0.0017; n = 4) in the mutant (88 ± 27/mm2) than in the control (167 ± 18/mm2) mice. D, Immunostainings for MBP (Da, Db), CC1 (Dc, Dd), and TUNEL (De, Df) in the peripheral areas of control and mutant cerebella. In Da, the dashed lines delineate the different cell layers and the fiber tracts in a P5 cerebellar lobe. egl, External granular cell layer; ml, molecular layer; gl, granular cell layer; ft, fiber tracts. the continuous line indicates the pial surface. Arrowheads in De and Df point to TUNEL-positive cells within the fiber tracts. Scale bars, 10 μm. Results are expressed as the mean ± SD.
Figure 6.
Figure 6.
Normal myelination in the cerebellum in the absence of β1-integrin. A, Representative EM pictures illustrate cross sections of myelinated fibers in the peripheral lobar area of 2-month-old control and mutant animals. The myelin sheaths in the mutant show no signs of dysmyelination. The graphic in B shows the linear regressions of the measured fibers in each animal. The dotted lines represent the mutants. The statistical analysis of the linear regressions reveals no significant difference (p = 0.83). C, D, The number of recombined, i.e., Bluogal positive, oligodendrocytes in the central and peripheral cerebellar regions of 6-week-old control and mutant animals (n = 3) were analyzed. The numbers calculated were not significantly different (central region, p = 0.74; peripheral region, p = 0.94). co, Control; mu, mutant. Scale bars: A, 1 μm; D, 50 μm. Results are expressed as the mean ± SD.

References

    1. Arnett HA, Fancy SP, Alberta JA, Zhao C, Plant SR, Kaing S, Raine CS, Rowitch DH, Franklin RJ, Stiles CD (2004). bHLH transcription factor Olig1 is required to repair demyelinated lesions in the CNS. Science 306:2111–2115. - PubMed
    1. Baron W, Shattil SJ, ffrench-Constant C (2002). The oligodendrocyte precursor mitogen PDGF stimulates proliferation by activation of alpha(v)beta3 integrins. EMBO J 21:1957–1966. - PMC - PubMed
    1. Blaess S, Graus-Porta D, Belvindrah R, Radakovits R, Pons S, Littlewood-Evans A, Senften M, Guo H, Li Y, Miner JH, Reichardt LF, Muller U (2004). Beta1-integrins are critical for cerebellar granule cell precursor proliferation. J Neurosci 24:3402–3412. - PMC - PubMed
    1. Blaschuk KL, Frost EE, ffrench-Constant C (2000). The regulation of proliferation and differentiation in oligodendrocyte progenitor cells by alphaV integrins. Development 127:1961–1969. - PubMed
    1. Brakebusch C, Grose R, Quondamatteo F, Ramirez A, Jorcano JL, Pirro A, Svensson M, Herken R, Sasaki T, Timpl R, Werner S, Fassler R (2000). Skin and hair follicle integrity is crucially dependent on beta 1 integrin expression on keratinocytes. EMBO J 19:3990–4003. - PMC - PubMed

Publication types

MeSH terms