. 2006 Jul 19;26(29):7741-55.
doi: 10.1523/JNEUROSCI.4658-05.2006.

Complex spike activity of purkinje cells in the oculomotor vermis during behavioral adaptation of monkey saccades

Affiliations

Complex spike activity of purkinje cells in the oculomotor vermis during behavioral adaptation of monkey saccades

Robijanto Soetedjo et al. J Neurosci. .

Abstract

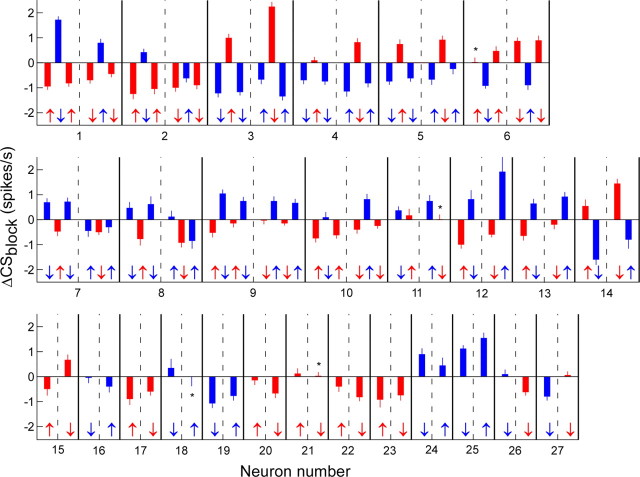
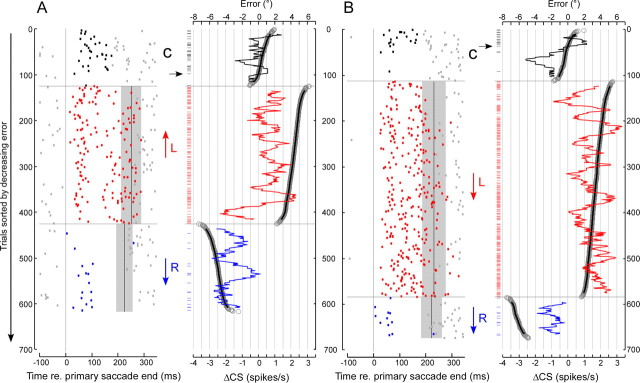
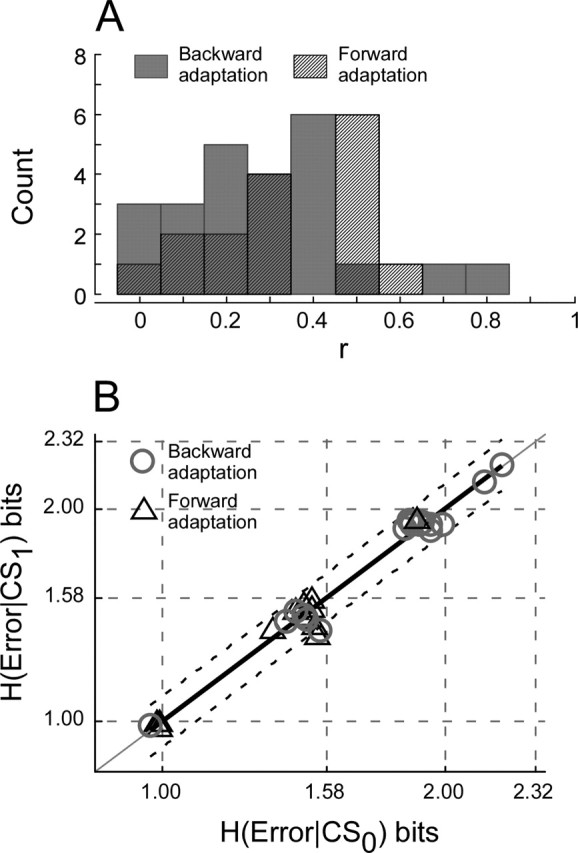
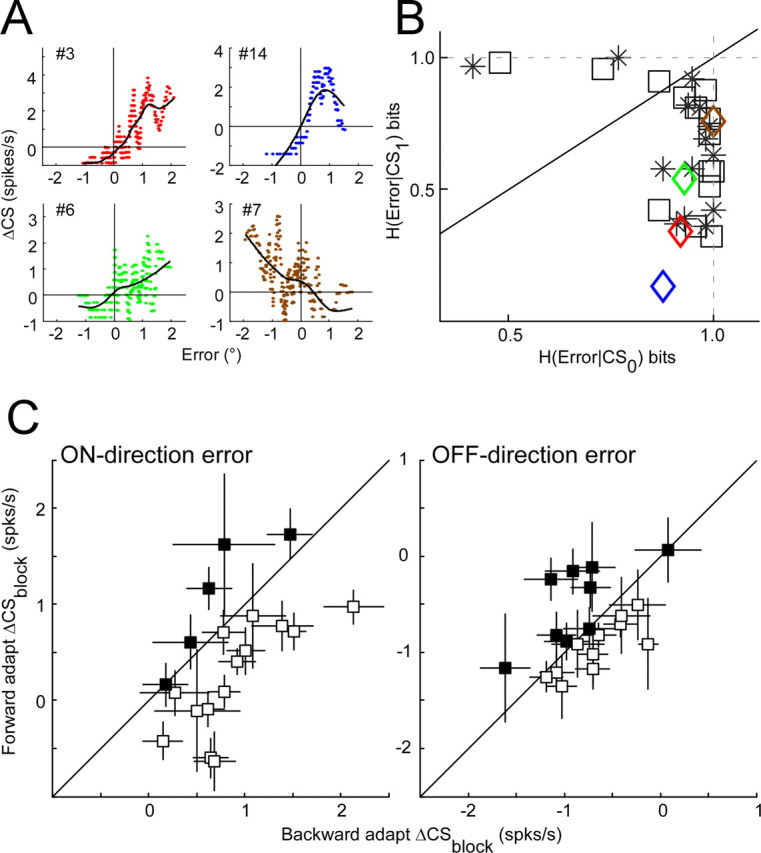
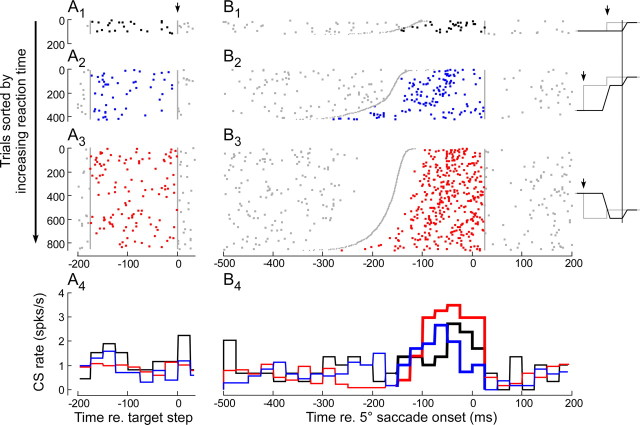
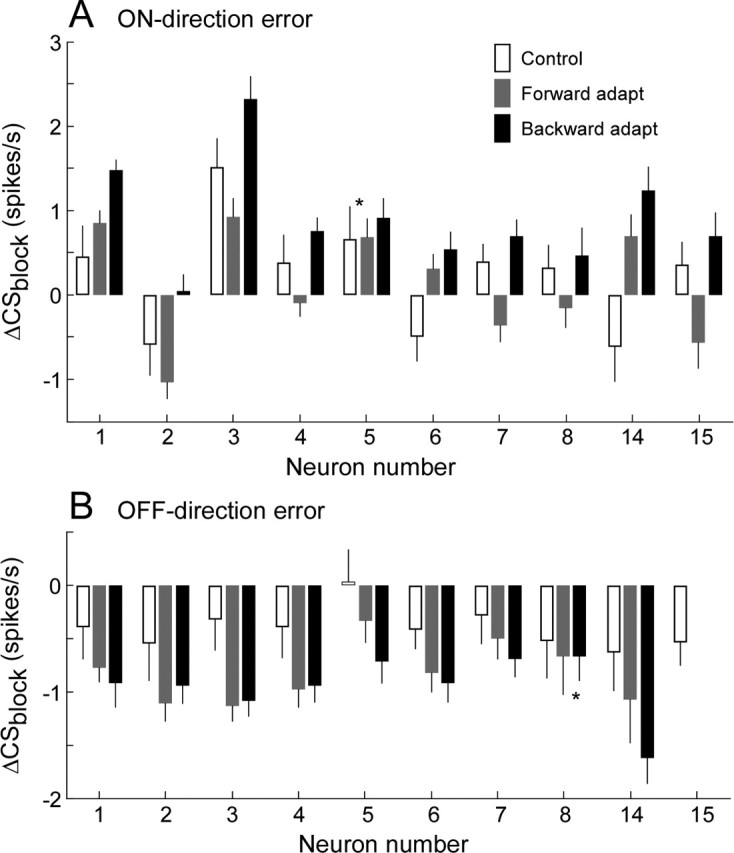
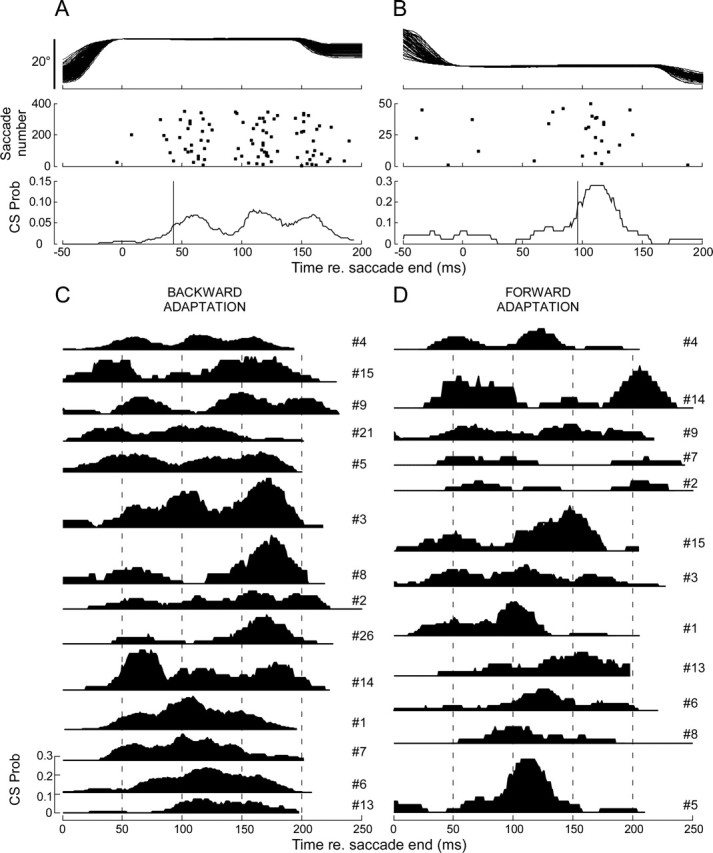
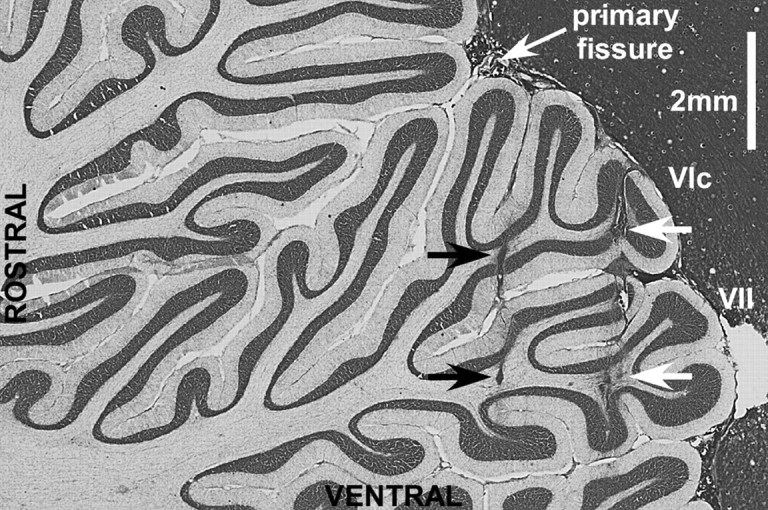
Throughout life, the oculomotor system can correct itself when saccadic eye movements become inaccurate. This adaptation mechanism can be engaged in the laboratory by displacing the target when the saccade toward it is in flight. Forward and backward target displacements cause gradual increases and decreases in saccade amplitude, respectively. Equipped with this paradigm, we asked whether Purkinje cells (P-cells) in the vermis of the oculomotor cerebellum, lobules VIc and VII, changed their complex spike (CS) discharge during the behavioral adaptation of horizontal saccades. We tested the hypothesis that CS activity would change only when a targeting saccade caused an error in eye position relative to the target, i.e., during the error interval between the primary and corrective saccades. We examined only those P-cells whose simple spike activity exhibited either a burst or pause with saccades in several directions. Approximately 80% of such P-cells exhibited an increase in CS activity during the error interval when the adaptation paradigm imposed horizontal eye-position errors in one direction and a decrease in activity for errors in the other. As adaptation progressed and errors were reduced, there was no consistent change in the CS activity. These data suggest that the CS activity of P-cells in the oculomotor vermis signals the direction but not the magnitude of eye-position error during saccade adaptation. Our results are consistent with cerebellar learning models that have been proposed to explain adaptation of the vestibulo-ocular reflex so similar mechanisms may also underlie plasticity of this precision voluntary oculomotor behavior.


Figures

Figure 1.
Figure 1.
Highly schematic model of the brainstem and cerebellar components of the saccadic system. Signals from the SC reach the brainstem BG for horizontal saccades through a relatively direct pathway and also via a side loop through the oculomotor cerebellum (shaded), which consists of the OMV (lobules VIc and VII) and the CFN to which it projects. In addition to a mossy fiber (mf) input from the SC delivered via the nucleus reticularis tegmenti pontis (NRTP), the OMV receives climbing fiber (cf) signals exclusively from the inferior olive (IO), which has been proposed to relay an error signal. The mossy fiber input results in the high rate simple spike discharge (inset, gray), whereas the climbing fiber input produces the complex spike (black), which occurs much less frequently. The P-cell in the inset shows a burst of simple spikes for the 5° saccade shown in the top trace. MN, Horizontal motoneurons, EOM; extraocular muscles.
Figure 2.
Figure 2.
Method of complex spike analysis illustrated on the first 30 trials of a gain reduction block. A, Calculation of the first term in Equation 1 (see Materials and Methods). Top panel shows all 30 saccadic responses aligned on the end of the primary saccade, and the bottom panel shows their associated CSs (squares). All of the CSs (filled squares) that occur in the interval from the end of the primary saccade to the onset of the corrective saccade plus 25 ms (vertical tics, jagged line) in the first 20 trials are added, and this sum is divided by the sum of all of the intersaccadic intervals in those trials to determine the average firing rate. B, Calculation of the second term in Equation 1. For the same 20 trials, CSs (filled squares) in the interval 175 ms before the target steps are counted and divided by 20 × 0.175 s to determine average background rate. The number generated in B is subtracted from that in A to determine ΔCS1. The process in A and B is then shifted to start at saccade 2 and repeated to determine ΔCS2, etc., thereby producing a 20-saccade running average of the CS discharge rate above the baseline. Open squares identify CSs not used for analysis.
Figure 3.
Figure 3.
SS discharge of two representative P-cells used in our analyses. All of the P-cells we subjected to CS analysis discharged either a burst (A) or pause (B) of simple spikes or both associated with saccades, usually in all directions. In both A and B, saccades were made to 15° target steps in eight radial directions from straight ahead and spaced every 45°, as shown in the two middle panels. In the surrounding panels, rasters aligned on saccade onset (dotted lines) show the time of occurrence of each SS of each trial and the associated average histogram (10 ms/bin) of all of the trials (n ≥17) in each direction.
Figure 4.
Figure 4.
Occurrence of CSs throughout each trial during different blocks of saccade adaptation for a representative P-cell. A, Leftward target steps. B, Rightward target steps. In both columns, the top panels show the time course of a representative eye movement during control saccades (black) and during rightward (blue) or leftward (red) errors aligned on the end of the primary saccade. The middle panels show the CSs (dots) associated with >600 trials in each direction plotted from top to bottom according to the progression of the experiment. In both columns, trials 1 to ∼120 are controls (C) with no adapt steps (CSs in error interval shown black). At trial ∼120, leftward saccades caused a forward adapt step (↑) and rightward a backward adapt step (↓), so errors were always leftward (CSs in error interval shown red). At trials ∼420 to the left and ∼580 to the right, left saccades caused a backward adapt step (↓) and right saccades a forward adapt (↑) step, so all errors were rightward (CSs in error interval shown blue). The gray bars indicate the SDs of the mean onset (solid vertical lines) of the corrective saccades within each adaptation block. Bottom panels show average histograms (25 ms bins) of all of the trials within each data block (thick line histogram colors correspond to those of CSs in error intervals above). For a complete explanation, see Results. This neuron was recorded at the center of the chamber, which was aligned along the midsagittal plane.
Figure 5.
Figure 5.
CS rate relative to baseline (ΔCSblock; Eq. 3) during different adaptation blocks for all 27 P-cells. Each bar represents the ΔCSblock from a different adaptation block. Bars to the left and right of the dashed lines are from leftward and rightward primary saccades, respectively. The error bar represents one SD computed from 1000 bootstrap samples (see Materials and Methods). Thick lines separate different P-cells. The upward and downward arrows represent forward and backward adaptation blocks, respectively. Blue identifies a rightward error, and red reflects a leftward error. These conventions will be used throughout the figures. Asterisks indicate data not significantly different from 0 (p > 0.05). The neuron illustrated in Figure 4 is neuron 14.
Figure 6.
Figure 6.
Comparison of running averages of the change of CS rate relative to baseline (ΔCS) and of the error for the P-cell shown in Figure 4 with the trials sorted according to decreasing error amplitude. A, Leftward primary saccades. B, Rightward primary saccades. Left panels use the same data as those between −100 and +350 ms in A and B of Figure 4. Right panels show the 20-trial running average of CS rate relative to baseline within the intrasaccadic interval (ΔCS; Eq. 1) (fluctuating curves) and the error for each saccade (gray circles) as well as its 20-trial running average (Eq. 2) (thick black curve). Short horizontal tick lines (left of right panels in A and B) show trials in which one or more CS occurs within the error interval. Horizontal arrows in A and B indicate when the error crosses 0. Note that 0 error crossing coincides with the time when CS suddenly stops firing. C, Control; L, leftward error; R, rightward error.
Figure 7.
Figure 7.
CS firing does not signal error size. A, Distribution of regression coefficients of relationships between ΔCS and error size for backward and forward adaptation blocks. Almost all are ≤0.5. B, Comparison of the entropy of error magnitude when a CS did (CS1) and did not (CS0) occur during forward and backward adaptation blocks. Dashed lines indicate 95% confidence intervals.
Figure 8.
Figure 8.
CS firing does signal error direction. A, Relationship between ΔCS and error size when the error was made to hover around 0 (see Results) for four neurons during backward adaptation. Horizontal and vertical lines indicate 0 spikes/s and 0° error. Curves are cubic spline fits. B, Comparison of the conditional entropy of error direction when a CS did (CS1) and did not (CS0) occur. Squares, asterisks, and diamonds represent data from backward adaptation, forward adaptation, and the four experiments shown in A, respectively. Black line has a slope of 1.0. C, Comparison of ΔCSblock for forward and backward adaptations with comparable error amplitudes. Each point represents data from a single P-cell. The error bar represents one SD computed from 1000 bootstrap samples (see Materials and Methods). On- and off-direction errors are considered separately.
Figure 9.
Figure 9.
CS activity associated with 5° control and corrective saccades. A1, B1, From 5° saccades to simple target steps. A2, B2, From 5° corrective saccades during forward adaptation. A3, B3, From 5° corrective saccades during backward adaptation. Data are from neuron 1 (Fig. 5). Inset to right, Schematic responses in these three conditions; gray line is target position, and black line is eye position. A1–A3, CS activity (dots) for the 200 ms before through the 25 ms after the target step, which occurs at t = 0.0 (↓). Gray lines bracket data used to determine baseline activity. B1–B3, CS rasters (dots) for 500 ms before to 200 ms after the saccade, aligned on saccade onset (t = 0.0). Trials within each condition are ordered according to saccade reaction time (B1) or intersaccadic interval (B2, B3). The time of the target step (B1) or end of the primary saccade (B2, B3) is shown by curve of gray dots. The intervals to analyze ΔCSblock extended from the curve of gray dots to t = 25 ms (vertical gray lines). A4, B4, The average histograms (25 ms bin) for each of the three conditions aligned on t = 0.0 and color-coded to match the CSs within the analysis intervals.
Figure 10.
Figure 10.
Comparison of ΔCSblock during control and forward and backward adaptation blocks calculated from data like those in Figure 9 for that neuron and nine others. A, On-direction error; B, Off-direction error. The error bar represents one SD computed from 1000 bootstrap samples (see Materials and Methods). Asterisk indicates that means are not significantly different (p > 0.05, unpaired t test). Neuron numbering is the same as in Figure 5.
Figure 11.
Figure 11.
Pattern of CS occurrence within the error interval. A, B, Two examples of CS distributions within the error interval with respect to the end of primary saccades. Variability of intersaccadic intervals was less than ±5 ms. Top two panels, Horizontal eye positions. Middle two panels, CS distributions represented by dots. Bottom two panels, Probability running average curves calculated from data in the middle panels. Vertical lines, Probability is half the maximum value. C, D, Collection of probability running average curves for backward and forward adaptation, respectively. From top to bottom, The curves qualitatively show less multimodality. Unit numbers (see Fig. 5) are shown next to the curves.
Figure 12.
Figure 12.
Parasagittal section of the vermis with the oculomotor folia, lobules VIc and VII, clearly shown. Black arrows indicate the location of electrolytic lesions in which hot saccade-related activity was recorded. White arrows point to more dorsal electrode tracks. Dark material surrounding the cerebellum is egg yolk.

Similar articles

Cited by

References

    1. Albus J (1971). A theory of cerebellar function. Math Biosci 10:25–61.
    1. Bahill AT, Clark MR, Stark L (1975). Dynamic overshoot in saccadic eye movements is caused by neurological control signed reversals. Exp Neurol 48:107–122. - PubMed
    1. Barash S, Melikyan A, Sivakov A, Zhang M, Glickstein M, Thier P (1999). Saccadic dysmetria and adaptation after lesions of the cerebellar cortex. J Neurosci 19:10931–10939. - PMC - PubMed
    1. Bloedel JR, Ebner TJ (1984). Rhythmic discharge of climbing fibre afferents in response to natural peripheral stimuli in the cat. J Physiol (Lond) 352:129–146. - PMC - PubMed
    1. Catz N, Dicke PW, Thier P (2005). Cerebellar complex spike firing is suitable to induce as well as to stabilize motor learning. Curr Biol 15:2179–2189. - PubMed

Publication types