

Transcription of the pst operon of Clostridium acetobutylicum is dependent on phosphate concentration and pH
- PMID: 16855236
- PMCID: PMC1540024
- DOI: 10.1128/JB.00491-06
Transcription of the pst operon of Clostridium acetobutylicum is dependent on phosphate concentration and pH
Abstract
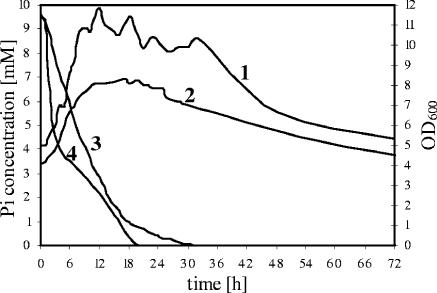
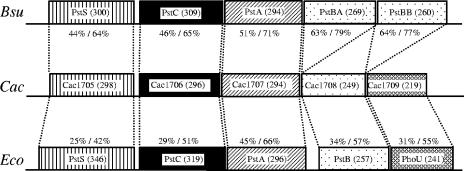
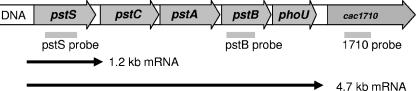
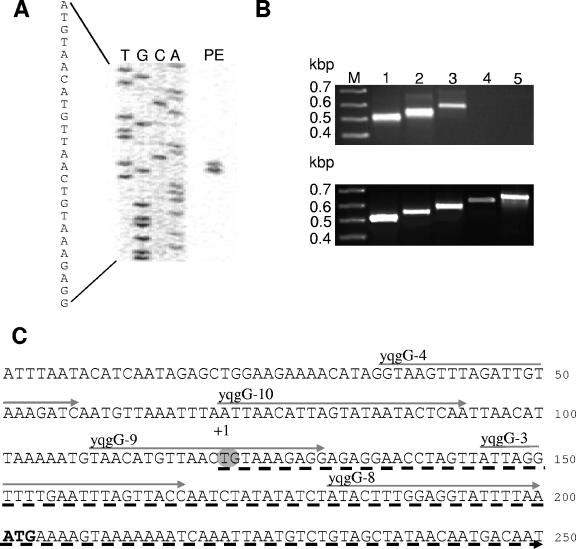
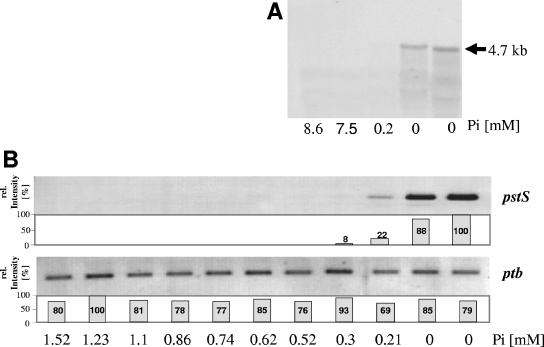
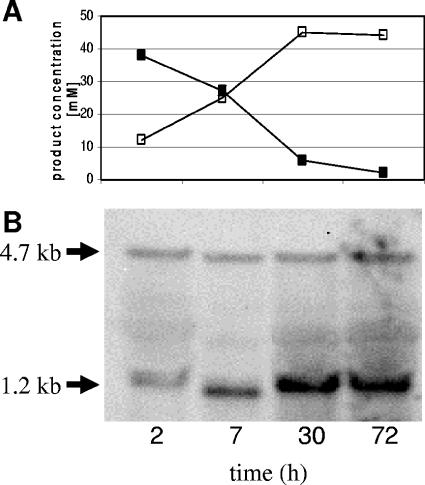
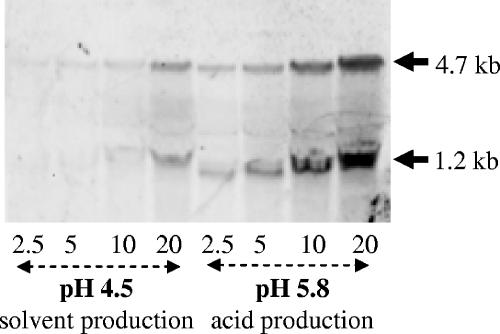
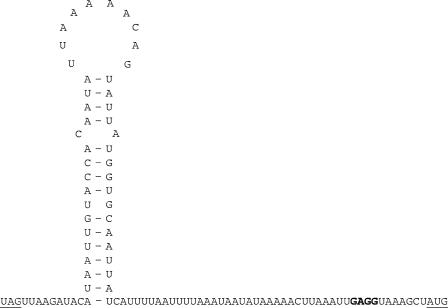
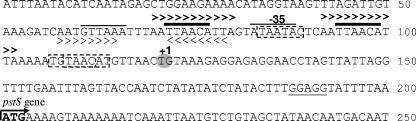
The pst operon of Clostridium acetobutylicum ATCC 824 comprises five genes, pstS, pstC, pstA, pstB, and phoU, and shows a gene architecture identical to that of Escherichia coli. Deduced proteins are predicted to represent a high-affinity phosphate-specific ABC (ATP-binding cassette) transport system (Pst) and a protein homologous to PhoU, a negative phosphate regulon regulator. We analyzed the expression patterns of the pst operon in P(i)-limited chemostat cultures during acid production at pH 5.8 or solvent production at pH 4.5 and in response to P(i) pulses. Specific mRNA transcripts were found only when external P(i) concentrations had dropped below 0.2 mM. Two specific transcripts were detected, a 4.7-kb polycistronic mRNA spanning the whole operon and a quantitatively dominating 1.2-kb mRNA representing the first gene, pstS. The mRNA levels clearly differed depending on the external pH. The amounts of the full-length mRNA detected were about two times higher at pH 5.8 than at pH 4.5. The level of pstS mRNA increased by a factor of at least 8 at pH 5.8 compared to pH 4.5 results. Primer extension experiments revealed only one putative transcription start point 80 nucleotides upstream of pstS. Thus, additional regulatory sites are proposed in the promoter region, integrating two different extracellular signals, namely, depletion of inorganic phosphate and the pH of the environment. After phosphate pulses were applied to a phosphate-limited chemostat we observed faster phosphate consumption at pH 5.8 than at pH 4.5, although higher optical densities were recorded at pH 4.5.
Figures
Similar articles
-
The two-component system PhoPR of Clostridium acetobutylicum is involved in phosphate-dependent gene regulation.J Bacteriol. 2008 Oct;190(20):6559-67. doi: 10.1128/JB.00574-08. Epub 2008 Aug 8. J Bacteriol. 2008. PMID: 18689481 Free PMC article.
-
Alternative promoters in the pst operon of Escherichia coli.Mol Genet Genomics. 2010 Dec;284(6):489-98. doi: 10.1007/s00438-010-0584-x. Epub 2010 Oct 21. Mol Genet Genomics. 2010. PMID: 20963440
-
Transcriptional analysis of the pst operon of Escherichia coli.Mol Genet Genomics. 2002 Dec;268(4):518-24. doi: 10.1007/s00438-002-0764-4. Epub 2002 Oct 29. Mol Genet Genomics. 2002. PMID: 12471449
-
Molecular aspects of phosphate transport in Escherichia coli.Mol Microbiol. 1990 Jul;4(7):1083-90. doi: 10.1111/j.1365-2958.1990.tb00682.x. Mol Microbiol. 1990. PMID: 1700257 Review.
-
From cell membrane to nucleotides: the phosphate regulon in Escherichia coli.Bioessays. 1990 Aug;12(8):371-6. doi: 10.1002/bies.950120804. Bioessays. 1990. PMID: 2241934 Review.
Cited by
-
Integrative modelling of pH-dependent enzyme activity and transcriptomic regulation of the acetone-butanol-ethanol fermentation of Clostridium acetobutylicum in continuous culture.Microb Biotechnol. 2013 Sep;6(5):526-39. doi: 10.1111/1751-7915.12033. Epub 2013 Jan 21. Microb Biotechnol. 2013. PMID: 23332010 Free PMC article.
-
The role of PerR in O2-affected gene expression of Clostridium acetobutylicum.J Bacteriol. 2009 Oct;191(19):6082-93. doi: 10.1128/JB.00351-09. Epub 2009 Jul 31. J Bacteriol. 2009. PMID: 19648241 Free PMC article.
-
Mathematical modelling of clostridial acetone-butanol-ethanol fermentation.Appl Microbiol Biotechnol. 2017 Mar;101(6):2251-2271. doi: 10.1007/s00253-017-8137-4. Epub 2017 Feb 16. Appl Microbiol Biotechnol. 2017. PMID: 28210797 Free PMC article. Review.
-
Global transcriptome analysis of Clostridium thermocellum ATCC 27405 during growth on dilute acid pretreated Populus and switchgrass.Biotechnol Biofuels. 2013 Dec 2;6(1):179. doi: 10.1186/1754-6834-6-179. Biotechnol Biofuels. 2013. PMID: 24295562 Free PMC article.
-
Parallel Evolution and Horizontal Gene Transfer of the pst Operon in Firmicutes from Oligotrophic Environments.Int J Evol Biol. 2011 Mar 3;2011:781642. doi: 10.4061/2011/781642. Int J Evol Biol. 2011. PMID: 21461370 Free PMC article.
References
Publication types
MeSH terms
Substances
LinkOut - more resources
Full Text Sources
Other Literature Sources
Molecular Biology Databases
Research Materials
Miscellaneous
