

TCF7L2 polymorphisms and progression to diabetes in the Diabetes Prevention Program
- PMID: 16855264
- PMCID: PMC1762036
- DOI: 10.1056/NEJMoa062418
TCF7L2 polymorphisms and progression to diabetes in the Diabetes Prevention Program
Abstract
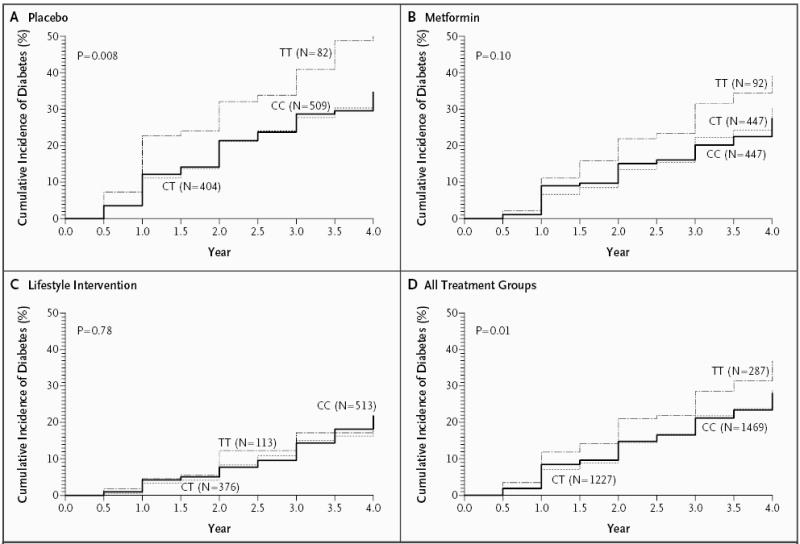
Background: Common polymorphisms of the transcription factor 7-like 2 gene (TCF7L2) have recently been associated with type 2 diabetes. We examined whether the two most strongly associated variants (rs12255372 and rs7903146) predict the progression to diabetes in persons with impaired glucose tolerance who were enrolled in the Diabetes Prevention Program, in which lifestyle intervention or treatment with metformin was compared with placebo.
Methods: We genotyped these variants in 3548 participants and performed Cox regression analysis using genotype, intervention, and their interactions as predictors. We assessed the effect of genotype on measures of insulin secretion and insulin sensitivity at baseline and at one year.
Results: Over an average period of three years, participants with the risk-conferring TT genotype at rs7903146 were more likely to have progression from impaired glucose tolerance to diabetes than were CC homozygotes (hazard ratio, 1.55; 95 percent confidence interval, 1.20 to 2.01; P<0.001). The effect of genotype was stronger in the placebo group (hazard ratio, 1.81; 95 percent confidence interval, 1.21 to 2.70; P=0.004) than in the metformin and lifestyle-intervention groups (hazard ratios, 1.62 and 1.15, respectively; P for the interaction between genotype and intervention not significant). The TT genotype was associated with decreased insulin secretion but not increased insulin resistance at baseline. Similar results were obtained for rs12255372.
Conclusions: Common variants in TCF7L2 seem to be associated with an increased risk of diabetes among persons with impaired glucose tolerance. The risk-conferring genotypes in TCF7L2 are associated with impaired beta-cell function but not with insulin resistance. (ClinicalTrials.gov number, NCT00004992. [ClinicalTrials.gov]).
Copyright 2006 Massachusetts Medical Society.
Figures


Comment in
-
Genetic variants and common diseases--better late than never.N Engl J Med. 2006 Jul 20;355(3):306-8. doi: 10.1056/NEJMe068140. N Engl J Med. 2006. PMID: 16855272 No abstract available.
References
-
- Barroso I. Genetics of type 2 diabetes. Diabet Med. 2005;22:517–35. - PubMed
-
- Florez JC, Hirschhorn JN, Altshuler D. The inherited basis of diabetes mellitus: implications for the genetic analysis of complex traits. Annu Rev Genomics Hum Genet. 2003;4:257–91. - PubMed
-
- Fajans SS, Bell GI, Polonsky KS. Molecular mechanisms and clinical pathophysiology of maturity-onset diabetes of the young. N Engl J Med. 2001;345:971–80. - PubMed
-
- Grant SFA, Thorleifsson G, Reynisdottir I, et al. Variant of transcription factor 7-like 2 (TCF7L2) gene confers risk of type 2 diabetes. Nat Genet. 2006;38:320–3. - PubMed
-
- Freely associating. Nat Genet. 1999;22:1–2. - PubMed
Publication types
MeSH terms
Substances
Associated data
Grants and funding
LinkOut - more resources
Full Text Sources
Other Literature Sources
Medical
Molecular Biology Databases