

An open-access long oligonucleotide microarray resource for analysis of the human and mouse transcriptomes
- PMID: 16855282
- PMCID: PMC1524919
- DOI: 10.1093/nar/gkl485
An open-access long oligonucleotide microarray resource for analysis of the human and mouse transcriptomes
Abstract
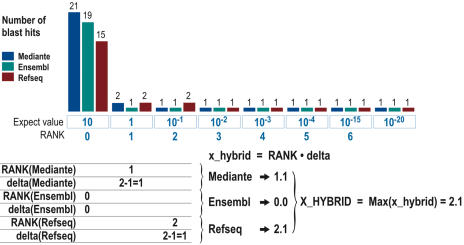
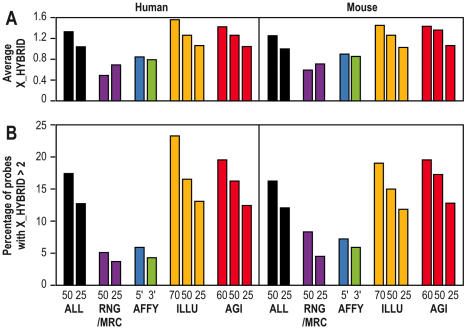
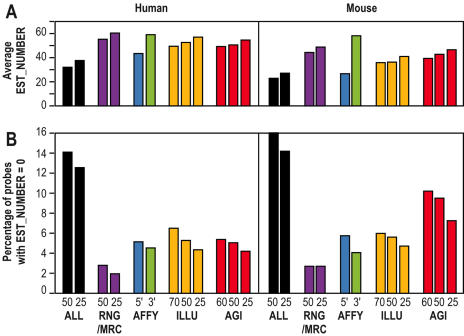
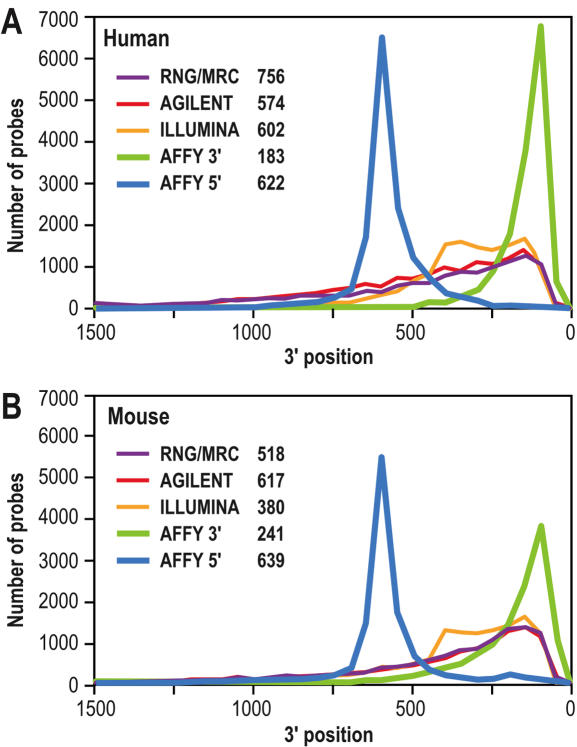
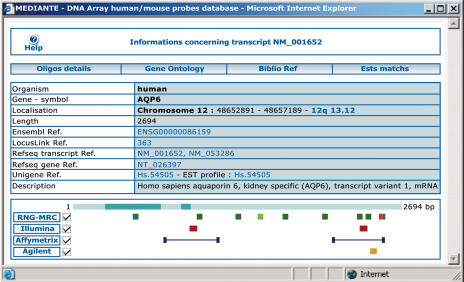
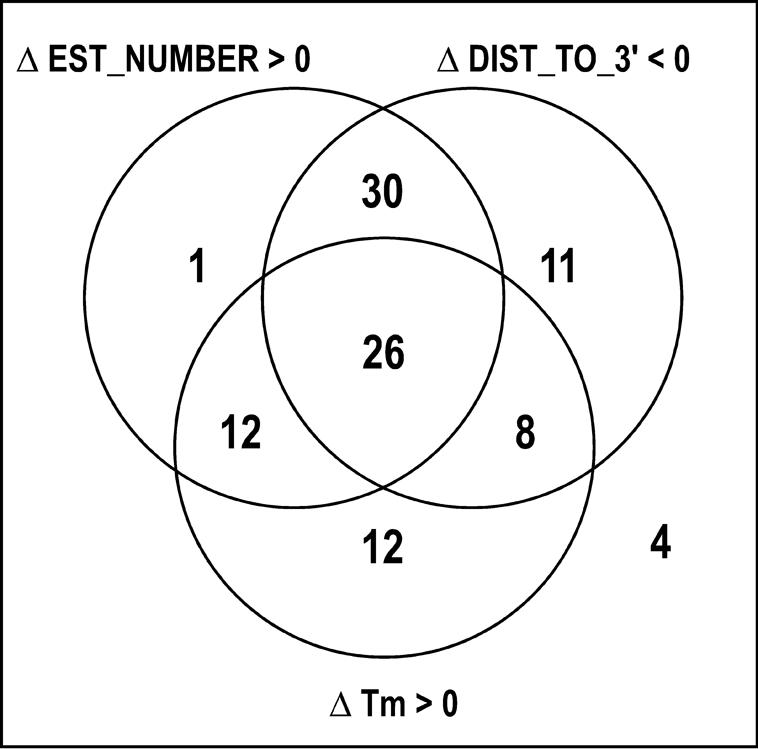
Two collections of oligonucleotides have been designed for preparing pangenomic human and mouse microarrays. A total of 148,993 and 121,703 oligonucleotides were designed against human and mouse transcripts. Quality scores were created in order to select 25,342 human and 24,109 mouse oligonucleotides. They correspond to: (i) a BLAST-specificity score; (ii) the number of expressed sequence tags matching each probe; (iii) the distance to the 3' end of the target mRNA. Scores were also used to compare in silico the two microarrays with commercial microarrays. The sets described here, called RNG/MRC collections, appear at least as specific and sensitive as those from the commercial platforms. The RNG/MRC collections have now been used by an Anglo-French consortium to distribute more than 3500 microarrays to the academic community. Ad hoc identification of tissue-specific transcripts and a approximately 80% correlation with hybridizations performed on Affymetrix GeneChiptrade mark suggest that the RNG/MRC microarrays perform well. This work provides a comprehensive open resource for investigators working on human and mouse transcriptomes, as well as a generic method to generate new microarray collections in other organisms. All information related to these probes, as well as additional information about commercial microarrays have been stored in a freely-accessible database called MEDIANTE.
Figures

Similar articles
-
OligoArrayDb: pangenomic oligonucleotide microarray probe sets database.Nucleic Acids Res. 2009 Jan;37(Database issue):D938-41. doi: 10.1093/nar/gkn761. Epub 2008 Oct 23. Nucleic Acids Res. 2009. PMID: 18948290 Free PMC article.
-
[Transcriptomes for serial analysis of gene expression].J Soc Biol. 2002;196(4):303-7. J Soc Biol. 2002. PMID: 12645300 Review. French.
-
AffyProbeMiner: a web resource for computing or retrieving accurately redefined Affymetrix probe sets.Bioinformatics. 2007 Sep 15;23(18):2385-90. doi: 10.1093/bioinformatics/btm360. Epub 2007 Jul 27. Bioinformatics. 2007. PMID: 17660211
-
In vitro identification and in silico utilization of interspecies sequence similarities using GeneChip technology.BMC Genomics. 2005 May 4;6:62. doi: 10.1186/1471-2164-6-62. BMC Genomics. 2005. PMID: 15871745 Free PMC article.
-
Mining mouse microarray data.Genome Biol. 2001;2(7):REVIEWS1019. doi: 10.1186/gb-2001-2-7-reviews1019. Epub 2001 Jul 3. Genome Biol. 2001. PMID: 11516341 Free PMC article. Review.
Cited by
-
Prostaglandin E2 regulates B cell proliferation through a candidate tumor suppressor, Ptger4.J Exp Med. 2008 Dec 22;205(13):3091-103. doi: 10.1084/jem.20081163. Epub 2008 Dec 15. J Exp Med. 2008. PMID: 19075289 Free PMC article.
-
The energy disruptor metformin targets mitochondrial integrity via modification of calcium flux in cancer cells.Sci Rep. 2017 Jul 11;7(1):5040. doi: 10.1038/s41598-017-05052-2. Sci Rep. 2017. PMID: 28698627 Free PMC article.
-
Skeletal muscle alterations and exercise performance decrease in erythropoietin-deficient mice: a comparative study.BMC Med Genomics. 2012 Jun 29;5:29. doi: 10.1186/1755-8794-5-29. BMC Med Genomics. 2012. PMID: 22748015 Free PMC article.
-
p63 regulates human keratinocyte proliferation via MYC-regulated gene network and differentiation commitment through cell adhesion-related gene network.J Biol Chem. 2012 Feb 17;287(8):5627-38. doi: 10.1074/jbc.M111.328120. Epub 2011 Dec 19. J Biol Chem. 2012. PMID: 22184109 Free PMC article.
-
Integrated protein network and microarray analysis to identify potential biomarkers after myocardial infarction.Funct Integr Genomics. 2010 Aug;10(3):329-37. doi: 10.1007/s10142-010-0169-0. Epub 2010 Apr 23. Funct Integr Genomics. 2010. PMID: 20414696
References
Publication types
MeSH terms
Substances
Grants and funding
LinkOut - more resources
Full Text Sources
Other Literature Sources
Research Materials
