. 2006 Sep 10;498(2):180-93.
doi: 10.1002/cne.21021.

Reevaluation of Drosophila melanogaster's neuronal circadian pacemakers reveals new neuronal classes

Affiliations

Reevaluation of Drosophila melanogaster's neuronal circadian pacemakers reveals new neuronal classes

Orie Thomas Shafer et al. J Comp Neurol. .

Abstract

In the brain of the fly Drosophila melanogaster, approximately 150 clock-neurons are organized to synchronize and maintain behavioral rhythms, but the physiological and neurochemical bases of their interactions are largely unknown. Here we reevaluate the cellular properties of these pacemakers by application of a novel genetic reporter and several phenotypic markers. First, we describe an enhancer trap marker called R32 that specifically reveals several previously undescribed aspects of the fly's central neuronal pacemakers. We find evidence for a previously unappreciated class of neuronal pacemakers, the lateral posterior neurons (LPNs), and establish anatomical, molecular, and developmental criteria to establish a subclass within the dorsal neuron 1 (DN1) group of pacemakers. Furthermore, we show that the neuropeptide IPNamide is specifically expressed by this DN1 subclass. These observations implicate IPNamide as a second candidate circadian transmitter in the Drosophila brain. Finally, we present molecular and anatomical evidence for unrecognized phenotypic diversity within each of four established classes of clock neurons.


Figures

Fig. 1
Fig. 1
R32-mediated LacZ expression in the adult brain. A: A projected Z-series montage of an adult R32 brain labeled for LacZ and imaged through its posterior surface. Cell classes are labeled in the left hemisphere. The dashed line represents the midline and the ventral aspect is labeled. Z-series depth was 150 μm. B: A projected Z-series through a single hemisphere of the dorsal protocerebrum, imaged through the dorsal surface. Two DN1as were clearly discernable in this orientation. The dashed line indicates the midline and the anterior aspect is labeled. Z-series depth was 80 μm. Scale bars = 100 μm in A; 20 μm in B.
Fig. 2
Fig. 2
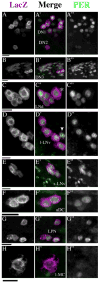
PER expression in R32-positive cells. R32 LacZ labeling is shown in the left column (A–H). The center column presents merged micrographs with R32-LacZ in magenta and PER in green (A′-H′). PER labeling is shown in the right column (A″-H″). A: The DN1 and DN2. B: The DN3, the asterisk in B′ indicates two large cells. C: Six LNd, asterisk in C′ indicates a single large cell. D: Four large LNv and fifth small LNv (indicated by the arrowhead in D′). E: Four small LNv, the smaller PER-positive cells are presumably glia. F: Two DN1as. G: Four LPNs, one cell is expressing PER very weakly. H: A single l-MC, no clear PER immunoreactivity was detected in these cells. Scale bars = 10 μm.
Fig. 3
Fig. 3
The LPNs express PER and TIM with a diurnal rhythm, are consistently situated near the posteriormost segment of the dorsal PDF projection, are present in wildtype brains, and express the neuronal marker ELAV. A: Representative micrographs of LPNs colabeled for R32 LacZ and PER (top panel) or R32 LacZ and TIM (bottom panel) at various times of day in a 12:12 LD cycle. Numbers indicate Zeitgeber Times. Merged micrographs are presented with R32 LacZ in magenta and PER and TIM in green. B: A Z-series with a depth of 5 μm through a portion of the dorsal PDF projection. B′: Merged Z-series of PDF projection (yellow) and R32lacZ (magenta). B″: Single-labeled Z-series of R32-Laz containing the LPN. The brain was imaged through the posterior surface of the brain. pot, posterior optic tract; dp, dorsal projection. C: A partial Z-series through the posterior half of a y w brain dissected at ZT23 and labeled for PER protein. Arrows in the left hemisphere indicate LPNs. The dashed line represents the midline. D: A single optical section through two LPNs labeled for PER at ZT 23. D′: The same optical section labeled for ELAV. D″: A merged micrograph with PER in yellow and ELAV in magenta. In D–D″ the colabeled neurons are marked by asterisks. Scale bars = 20 μm in B; 100 μm in C; 5 μm in D. [Color figure can be viewed in the online issue, which is available at www.interscience.wiley.com.]
Fig. 4
Fig. 4
The DN1as express PER and TIM with a diurnal rhythm and are consistently situated in dorsal brain regions anterior to the DN2, DN1s, and PDF terminals. A: Representative micrographs of DN1as colabeled for R32 LacZ and PER and R32 LacZ and TIM at various times of day in a 12:12 LD cycle. Numbers indicate Zeitgeber Times. Merged micrographs are presented with R32 LacZ in magenta and PER and TIM in green. B: A Z-series with a depth of 52 μm through the dorsoposterior surface (see text) of an R32 brain colabeled for R32 LacZ (magenta) and PDF (yellow). The DN1as are indicated by asterisks and lie just beneath the dorsal surface of the brain. The dorsal PDF projection is indicated by arrowheads. C: A Z-series with a depth of 26 μm through the dorsal surface of a y w brain dissected at ZT23 and labeled for PER. The dashed line indicates the midline. The DN1as are visible as two PER-positive nuclei anterior and medial to the DN1s. Scale bars = 50 μm in B; 50 μm in C. [Color figure can be viewed in the online issue, which is available at www.interscience.wiley.com.]
Fig. 5
Fig. 5
The DN1a express the neuropeptide IPNa. A: A Z-series with a depth of 75 μm through posterior surface of an R32 brain labeled for R32 LacZ. A′: The same Z-series for IPNa labeling. A″: A merged micrograph of IPNa (yellow) and R32-LacZ (magenta). Dorsal is up. Asterisks indicate IPNa expression in the DN1a in A–A″. B: A Z-series with a depth of 17 μm through the dorsal surface of a y w brain dissected at ZT23 and labeled for PER. B′: The same Z-stack for IPNa labeling. B″: The merged micrographs with PER in magenta and IPNa in yellow. Anterior is up. Asterisks indicate IPNa expression in the DN1a. Scale bars = 10 μm in A; 20 μm in B. [Color figure can be viewed in the online issue, which is available at www.interscience.wiley.com.]
Fig. 6
Fig. 6
The DN1a do not express GLASS and survive the glass mutation. A: A Z-series with a depth of 23 μm through the DN1a, DN1p, and DN2 in an R32 brain, labeled for LacZ. A′: the same Z-series for GLASS labeling. A″: A merged micrograph of LacZ (magenta) and IPNa (yellow) labeling. Only the DN1p expressed glass. In A–A″ the positions of the DN1a are indicated by asterisks. This preparation was imaged through the posterior surface of the brain. Dorsal is up. B: PER expression in a y w brain dissected at ZT23. C: PER expression in a y w;;glass60j brain dissected at ZT23. Z-series in C and D are 80 μm deep and both brains were imaged through the posterior surface. Dorsal is up. Laser power was higher for the y w;;glass60j micrograph (C) to ensure the detection of all weakly PER-positive cells. For this reason PER-positive glia are visible in B but not in C. The numbering of the DN1s as 1 and 2 and the DN2 as 3 in C are for reference in the following panels. D–D″: A single optical section of the DN1 labeled 1 in panel C labeled for IPNa (D) and PER (D″) the merged image is shown in D′ with IPNa in green and PER in magenta. E–E″: A single optical section of the DN1 labeled 2 in panel C labeled for IPNa (E) and PER (E″) the merged image is shown in E′ with IPNa in green and PER in magenta. F–F″: A single optical section of the DN2s labeled 3 in C, labeled for IPNa (F) and PER (F″). The merged image is shown in F′ with IPNa in green and PER in magenta. The surviving DN1 (neurons 1 and 2 in C) display cytoplasmic IPNa (D and E), while the DN2s (labeled 3 in C) do not express this peptide (F). Scale bars = 10 μm in A; 20 μm in B,C; 5 μm in D. [Color figure can be viewed in the online issue, which is available at www.interscience.wiley.com.]
Fig. 7
Fig. 7
The larval DN1s express IPNa. A: A Z-series with a depth of 31 μm from an R32 larval brain labeled for LacZ at ZT 23. A′: A merged micrograph of the same Z-series for LacZ (magenta) and PER (yellow). A″: The same Z-series for PER only. LacZ expression in the larval brain reveals many neurons that do not express PER. These are marked with asterisks in the left hemisphere in A′. B: A Z-series with a depth of 22 μm within a larval brain containing the targeted expression of GFP by Cry-gal4(16). Visualization of GFP reveals the larval DN1s and LNvs, but not the DN2s. B′: IPNa labeling in the same Z-series. B″: Merged micrographs of IPNa (magenta) and GFP (green). IPNa was expressed in both larval DN1s. An asterisk indicates the position of the DN1s in B–B″. Scale bars = 20 μm. [Color figure can be viewed in the online issue, which is available at www.interscience.wiley.com.]
Fig. 8
Fig. 8
The projections of larval DN1s and adult DN1as are closely associated with the dorsal PDF projection. A,B: A Z-series with a depth of 44 μm through the DN1 and LNv of a Cry-Gal4(16)/uas-cd8GFP larval brain labeled for PDF. A: GFP only. Arrowheads mark the projection of the DN1s. B: A merged micrograph of GFP (green) and PDF (magenta). Note the GFP-only terminals to the right of the PDF projection. These presumably arise from the DN1s. C: A Z-series through the DNs and LNds of a Cry-gal4(13)/uas-GFP, displaying GFP only. The DN1as are visible in this series as are two DN1p, two DN3, six LNds, and one l-LNv. The projection of a single DN1a is marked with arrowheads. D: A merged micrograph of GFP (green) and PDF (blue) from the same Z-series. This represents an atypical preparation in which a DN1a projection could be discerned from the dorsal PDF projection and followed to the accessory medulla. Scale bars = 20 μm in A (applies to B); 50 μm in C (applies to D).
Fig. 9
Fig. 9
The LNd, DN1p, and DN3 each display a variety of soma sizes. A: Single optical sections through all LNds of a single R32 brain hemisphere labeled for LacZ were visually isolated from neighboring cells and ranked qualitatively from largest to smallest diameter. B: A like ordering of all LNds from a single hemisphere of a wildtype brain colabeled for PER (magenta) and PDP1 (yellow) at ZT18. C: All DN1ps from a single hemisphere of an R32 brain labeled for LacZ and presented as above. D: All DN1ps from single hemisphere of a wild-type brain co-labeled for PER (magenta) and PDP1 (yellow) at ZT18. E: A 12-μm Z-series through the DN3s from an R32 brain labeled for LacZ. DN3s were imaged through the dorsal surface of the brain. Asterisks indicate two large DN3s. F: A 13-μm Z-series through the DN3s in Tim-Gal4/uas-gfp brain dissected at ZT23 and visualized for GFP. F′: The same Z-series as a merged micrograph of GFP (green) and PER (magenta) expression. F″: The same Z-series showing PER expression only. DN3s were imaged as in E. Asterisks in F–F″ indicate five larger neurons among the DN3. Scale bars = 5 μm in A–D; Scale bar = 20 μm in E,F. [Color figure can be viewed in the online issue, which is available at www.interscience.wiley.com.]
Fig. 10
Fig. 10
A reevaluation of the fly's neuronal clockwork. A: A map of clock neuron soma in the adult brain of Drosophila. The schematic represents only one hemisphere. Our data revealed two new classes of clock neurons, the LPNs and the DN1as. The canonical DN1s have been redesignated DN1ps. Our results also revealed a diversity of soma sizes within the LNds, DN3, and DN1ps. Larger cell bodies are presented in color. B: Peptidergic and anatomical interactions between the s-LNv and the DN1a. Our data revealed that DN1ps express IPNamide. The DN1as project toward the dorsal PDF projection and in some cases ventrally and anteriorly toward the accessory medulla. [Color figure can be viewed in the online issue, which is available at www.interscience.wiley.com.]

Similar articles

Cited by

References

    1. Baggerman G, Cerstiaens A, De Loof A, Schoofs L. Peptidomics of the larval Drosophila melanogaster central nervous system. J Biol Chem. 2002;277:40368–40374. - PubMed
    1. Cyran SA, Buchsbaum AM, Reddy KL, Lin MC, Glossop MR, Hardin PE, Young MW, Storti RV, Blau J. vrille, Pdp1, and dClock form a second feedback loop in the Drosophila circadian clock. Cell. 2003;112:329–341. - PubMed
    1. Dunlap JC. Molecular bases for circadian clocks. Cell. 1999;96:271–790. - PubMed
    1. Ewer J, Frisch B, Hamblen-Coyle MJ, Rosbash M, Hall JC. Expression of the period clock gene within different cell types in the brain of Drosophila adults and mosaic analysis of these cells' influence on circadian behavioral rhythms. J Neurosci. 1992;12:3321–3349. - PMC - PubMed
    1. Frisch B, Hardin PE, Hamblen-Coyle MJ, Rosbash M, Hall JC. A promoterless period gene mediates behavioral rhythmicity and cyclical per expression in a restricted subset of the Drosophila nervous system. Neuron. 1994;12:555–570. - PubMed

Publication types

MeSH terms

LinkOut - more resources