. 2006 Jul 20:3:17.
doi: 10.1186/1743-0003-3-17.

Quantification of functional weakness and abnormal synergy patterns in the lower limb of individuals with chronic stroke

Affiliations

Quantification of functional weakness and abnormal synergy patterns in the lower limb of individuals with chronic stroke

Nathan Neckel et al. J Neuroeng Rehabil. .

Abstract

Background: The presence of abnormal muscle activation patterns is a well documented factor limiting the motor rehabilitation of patients following stroke. These abnormal muscle activation patterns, or synergies, have previously been quantified in the upper limbs. Presented here are the lower limb joint torque patterns measured in a standing position of sixteen chronic hemiparetic stroke subjects and sixteen age matched controls used to examine differences in strength and coordination between the two groups.

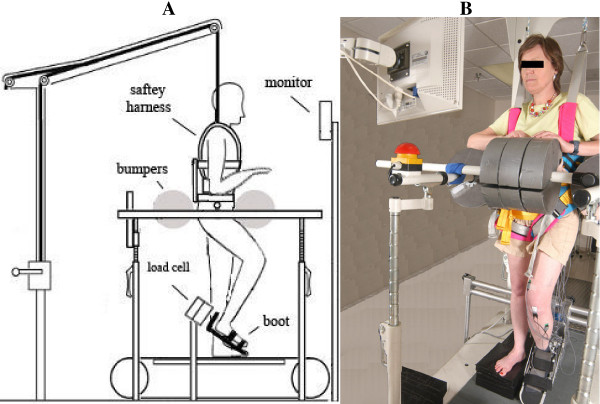
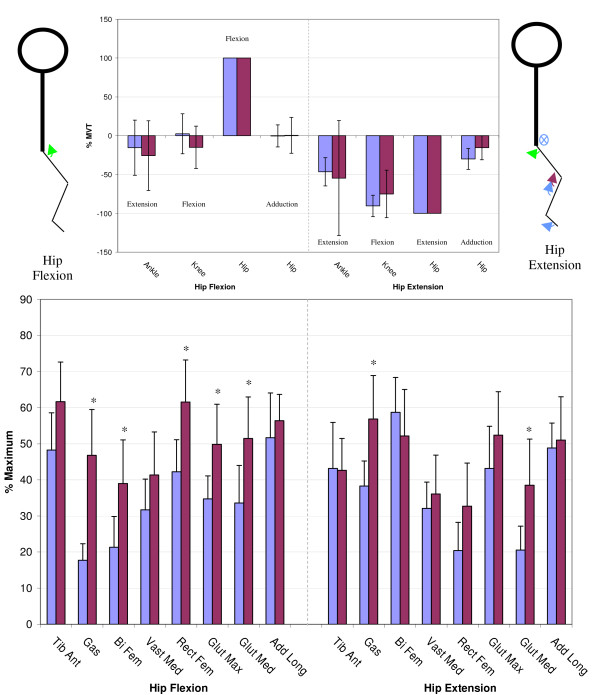
Methods: With the trunk stabilized, stroke subjects stood on their unaffected leg while their affected foot was attached to a 6-degree of freedom load cell (JR3, Woodland CA) which recorded forces and torques. The subjects were asked to generate a maximum torque about a given joint (hip abduction/adduction; hip, knee, and ankle flexion/extension) and provided feedback of the torque they generated for that primary joint axis. In parallel, EMG data from eight muscle groups were recorded, and secondary torques generated about the adjacent joints were calculated. Differences in mean primary torque, secondary torque, and EMG data were compared using a single factor ANOVA.

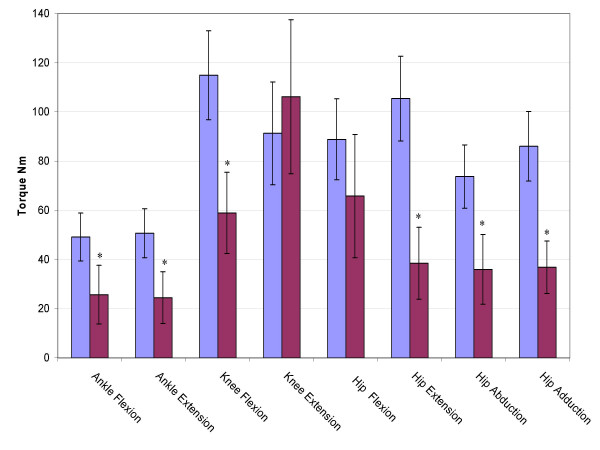
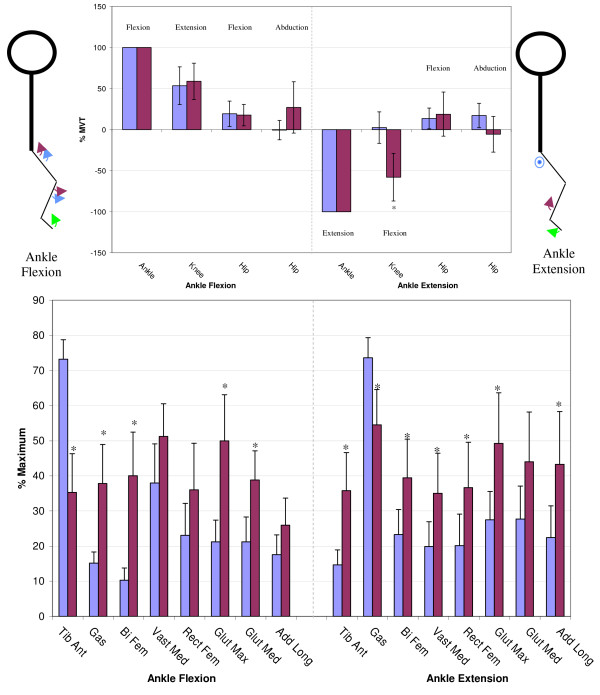
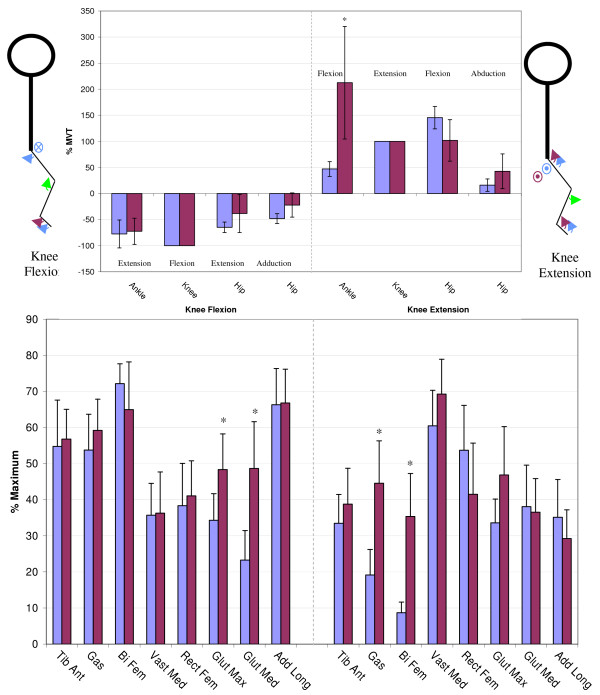
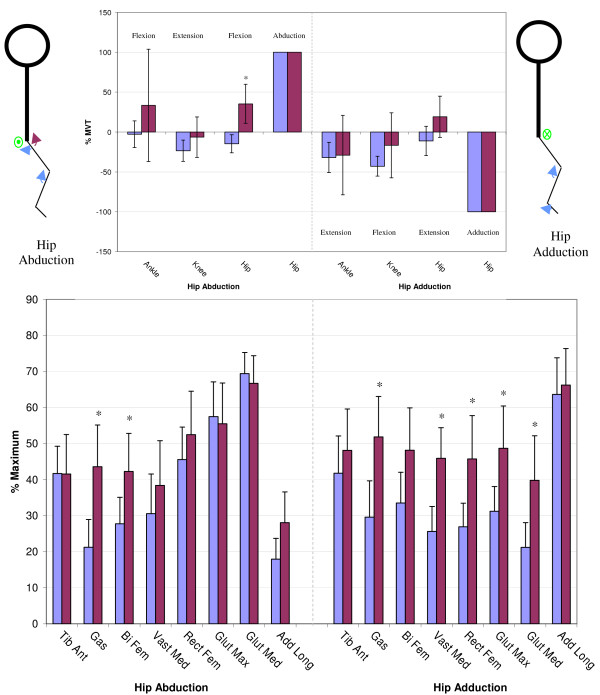
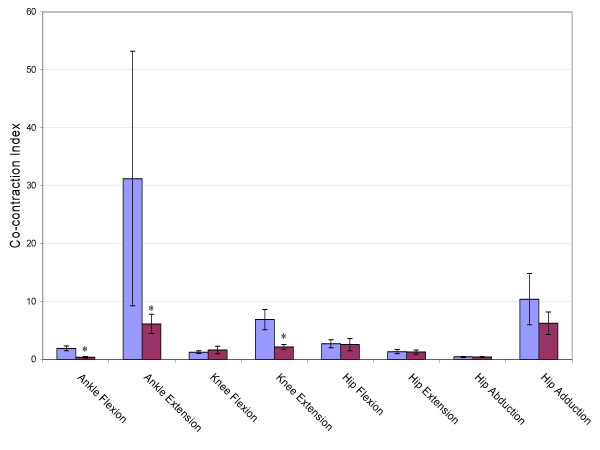
Results: The stroke group was significantly weaker in six of the eight directions tested. Analysis of the secondary torques showed that the control and stroke subjects used similar strategies to generate maximum torques during seven of the eight joint movements tested. The only time a different strategy was used was during maximal hip abduction exertions where stroke subjects tended to flex instead of extend their hip, which was consistent with the classically defined "flexion synergy." The EMG data of the stroke group was different than the control group in that there was a strong presence of co-contraction of antagonistic muscle groups, especially during ankle flexion and ankle and knee extension.

Conclusion: The results of this study indicate that in a standing position stroke subjects are significantly weaker in their affected leg when compared to age-matched controls, yet showed little evidence of the classic lower-limb abnormal synergy patterns previously reported. The findings here suggest that the primary contributor to isometric lower limb motor deficits in chronic stroke subjects is weakness.


Figures

Figure 1
Figure 1
Experimental Set-up. A. Subjects were secured in a standing position with foam bumpers pinching the hips from four sides and a safety harness prevented subjects from slipping down. The subject's foot was attached to a boot that was fixed to a six DOF load cell that would measure joint torques about the hip, knee and ankle. A monitor provided feedback on the torque generated in the primary joint direction. EMG activity was recorded from eight muscles. B. Photograph of experimental setup.
Figure 2
Figure 2
Maximum Voluntary Torques. The maximum voluntary joint torques for the stroke (red) and control (blue) groups expressed in Newton meters for the eight primary directions ankle flexion through hip adduction. Error bars represent 95% confidence interval. Significant differences (p < 0.05) are denoted *.
Figure 3
Figure 3
Secondary Torques During Ankle Flexion/Extension. The top graphs show the secondary joint torques for the stroke (red) and control (blue) groups expressed in %MVT for ankle flexion (left) and ankle extension (right). The stick figures show the primary joint direction (green) as well as the secondary torques of the control (blue) and stroke (red) for the secondary joint torques that are significantly greater than zero. Abduction is denoted as a circled dot (out of the page), adduction is denoted a circled X (into the page). The bottom graph shows the EMG activity for the stroke (red) and control (blue) groups expressed in % maximum value during ankle flexion MVT (left) and ankle extension MVT (right). Error bars represent 95% confidence interval. Significant differences between groups (p < 0.05) are denoted *. Tib Ant – tibilias anterior, Gas – gastrocnemius, Bi Fem – biceps femoris, Vast Med – vastus medialis, Rect Fem – rectus femoris, Glut Max -gluteus maximus, Glut Med – gluteus medius, Add Long – adductor longus.
Figure 4
Figure 4
Secondary Torques During Knee Flexion/Extension. The top graphs show the secondary joint torques for the stroke (red) and control (blue) groups expressed in %MVT for knee flexion (left) and knee extension (right). The stick figures show the primary joint direction (green) as well as the secondary torques of the control (blue) and stroke (red) for the secondary joint torques that are significantly greater than zero. Abduction is denoted as a circled dot (out of the page), adduction is denoted a circled X (into the page). The bottom graph shows the EMG activity for the stroke (red) and control (blue) groups expressed in % maximum value during knee flexion MVT (left) and knee extension MVT (right). Error bars represent 95% confidence interval. Significant differences between groups (p < 0.05) are denoted *. Tib Ant – tibilias anterior, Gas – gastrocnemius, Bi Fem – biceps femoris, Vast Med – vastus medialis, Rect Fem – rectus femoris, Glut Max -gluteus maximus, Glut Med – gluteus medius, Add Long – adductor longus.
Figure 5
Figure 5
Secondary Torques During Hip Flexion/Extension. The top graphs show the secondary joint torques for the stroke (red) and control (blue) groups expressed in %MVT for hip flexion (left) and hip extension (right). The stick figures show the primary joint direction (green) as well as the secondary torques of the control (blue) and stroke (red) for the secondary joint torques that are significantly greater than zero. Abduction is denoted as a circled dot (out of the page), adduction is denoted a circled X (into the page). The bottom graph shows the EMG activity for the stroke (red) and control (blue) groups expressed in % maximum value during hip flexion MVT (left) and hip extension MVT (right). Error bars represent 95% confidence interval. Significant differences between groups (p < 0.05) are denoted *. Tib Ant – tibilias anterior, Gas – gastrocnemius, Bi Fem – biceps femoris, Vast Med – vastus medialis, Rect Fem – rectus femoris, Glut Max -gluteus maximus, Glut Med – gluteus medius, Add Long – adductor longus.
Figure 6
Figure 6
Secondary Torques During Hip Abduction/Adduction. The top graphs show the secondary joint torques for the stroke (red) and control (blue) groups expressed in %MVT for hip abduction (left) and hip adduction (right). The stick figures show the primary joint direction (green) as well as the secondary torques of the control (blue) and stroke (red) for the secondary joint torques that are significantly greater than zero. Abduction is denoted as a circled dot (out of the page), adduction is denoted a circled X (into the page). The bottom graph shows the EMG activity for the stroke (red) and control (blue) groups expressed in % maximum value during hip abduction MVT (left) and hip adduction MVT (right). Error bars represent 95% confidence interval. Significant differences between groups (p < 0.05) are denoted *. Tib Ant – tibilias anterior, Gas – gastrocnemius, Bi Fem – biceps femoris, Vast Med – vastus medialis, Rect Fem – rectus femoris, Glut Max -gluteus maximus, Glut Med – gluteus medius, Add Long – adductor longus.
Figure 7
Figure 7
Co-contraction Index. Cocontraction index for the eight primary joint torques. Larger values represent lower levels of cocontraction. Error bars represent 95% confidence interval. Significant differences between groups (p < 0.05) are denoted *.

Similar articles

Cited by

References

    1. Bourbonnais D, Vanden Noven S. Weakness in patients with hemiparesis. Am J Occup Ther. 1989;43:313–9. - PubMed
    1. Duncan PW, Badke MB. Stroke Rehabilitation: The Recovery of Motor Control. Chicago, Year Book Medical Pub; 1987.
    1. Scelsi R, Lotta S, Lommi G, Poggi P, Marchetti C. Hemiplegic atrophy. Morphological findings in the anterior tibial muscle of patients with cerebral vascular accidents. Acta Neuropathol. 1984;62:324–31. doi: 10.1007/BF00687615. - DOI - PubMed
    1. McComas AJ, Sica RE, Upton AR, Aguilera N. Functional changes in motoneurones of hemiparetic patients. J Neurol Neurosurg Psychiatry. 1973;36:183–93. - PMC - PubMed
    1. Newham DJ, Hsiao SF. Knee muscle isometric strength, voluntary activation and antagonist co-contraction in the first six months after stroke. Disability and Rehabilitation. 2001;23:379–386. doi: 10.1080/0963828001006656. - DOI - PubMed

Publication types

LinkOut - more resources