

Myofibrillar troponin exists in three states and there is signal transduction along skeletal myofibrillar thin filaments
- PMID: 16857209
- PMCID: PMC2834179
- DOI: 10.1016/j.jmb.2006.05.078
Myofibrillar troponin exists in three states and there is signal transduction along skeletal myofibrillar thin filaments
Abstract
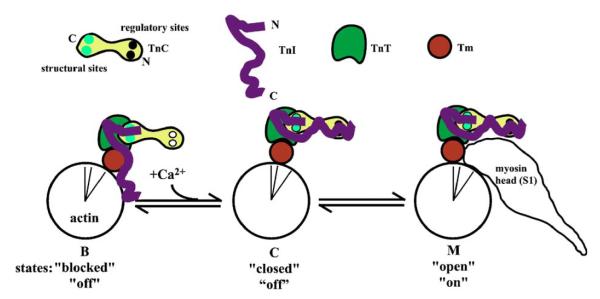
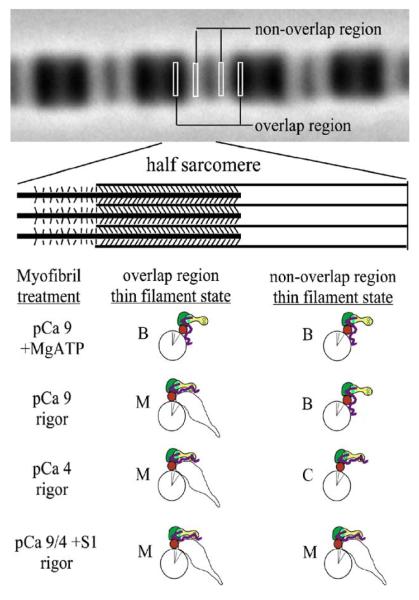
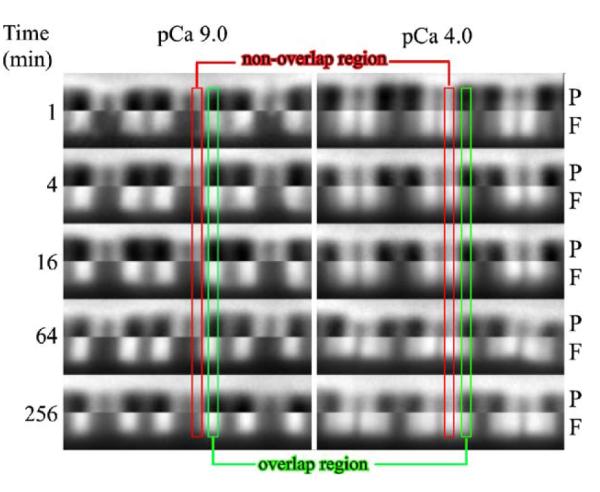
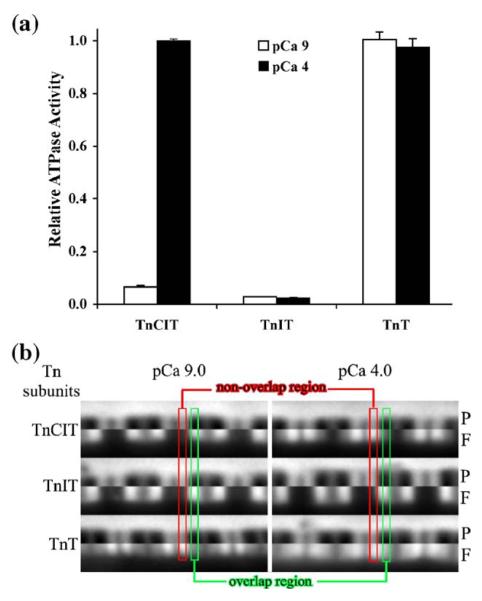
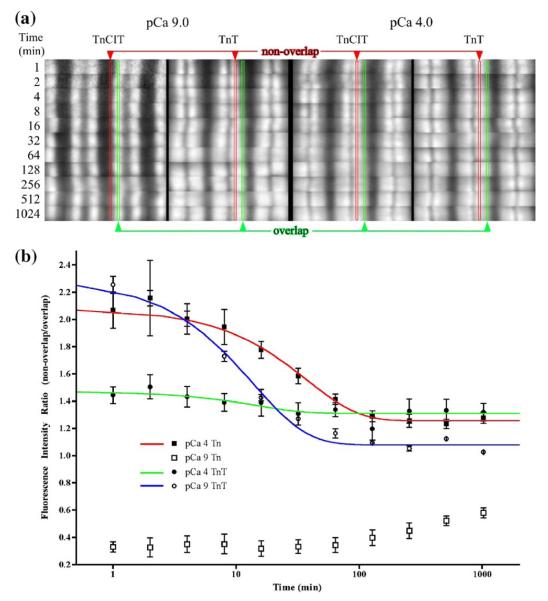
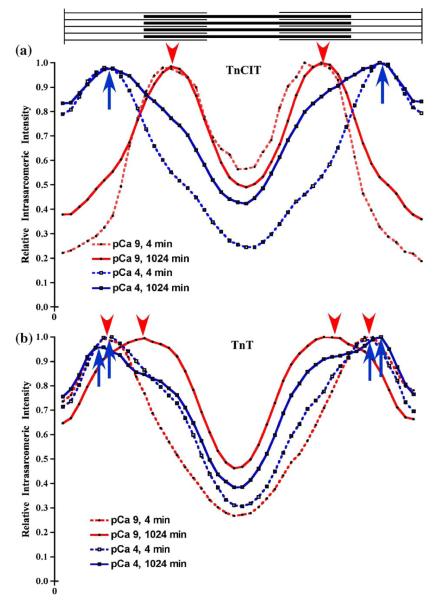
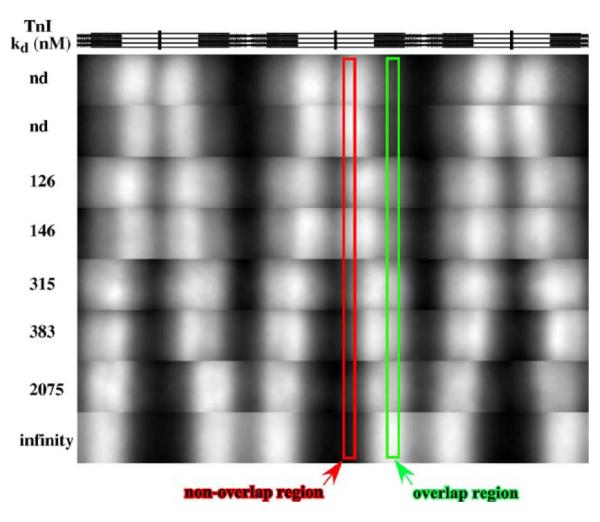
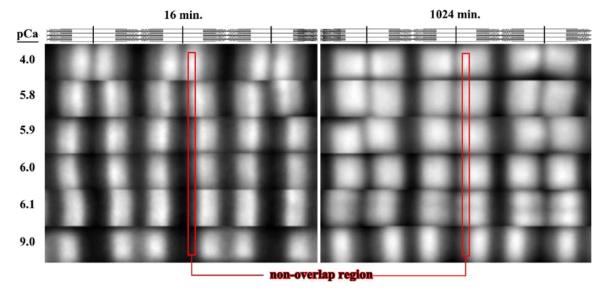
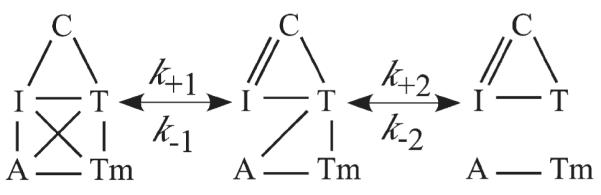
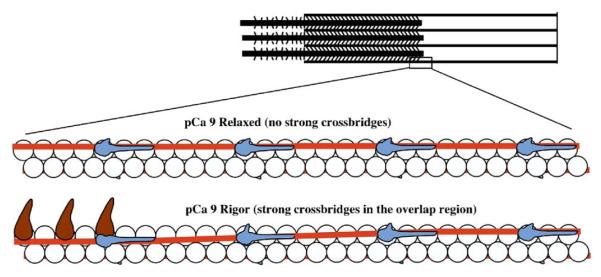
Activation of striated muscle contraction is a highly cooperative signal transduction process converting calcium binding by troponin C (TnC) into interactions between thin and thick filaments. Once calcium is bound, transduction involves changes in protein interactions along the thin filament. The process is thought to involve three different states of actin-tropomyosin (Tm) resulting from changes in troponin's (Tn) interaction with actin-Tm: a blocked (B) state preventing myosin interaction, a closed (C) state allowing weak myosin interactions and favored by calcium binding to Tn, and an open or M state allowing strong myosin interactions. This was tested by measuring the apparent rate of Tn dissociation from rigor skeletal myofibrils using labeled Tn exchange. The location and rate of exchange of Tn or its subunits were measured by high-resolution fluorescence microscopy and image analysis. Three different rates of Tn exchange were observed that were dependent on calcium concentration and strong cross-bridge binding that strongly support the three-state model. The rate of Tn dissociation in the non-overlap region was 200-fold faster at pCa 4 (C-state region) than at pCa 9 (B-state region). When Tn contained engineered TnC mutants with weakened regulatory TnI interactions, the apparent exchange rate at pCa 4 in the non-overlap region increased proportionately with TnI-TnC regulatory affinity. This suggests that the mechanism of calcium enhancement of the rate of Tn dissociation is by favoring a TnI-TnC interaction over a TnI-actin-Tm interaction. At pCa 9, the rate of Tn dissociation in the overlap region (M-state region) was 100-fold faster than the non-overlap region (B-state region) suggesting that strong cross-bridges increase the rate of Tn dissociation. At pCa 4, the rate of Tn dissociation was twofold faster in the non-overlap region (C-state region) than the overlap region (M-state region) that likely involved a strong cross-bridge influence on TnT's interaction with actin-Tm. At sub-maximal calcium (pCa 6.2-5.8), there was a long-range influence of the strong cross-bridge on Tn to enhance its dissociation rate, tens of nanometers from the strong cross-bridge. These observations suggest that the three different states of actin-Tm are associated with three different states of Tn. They also support a model in which strong cross-bridges shift the regulatory equilibrium from a TnI-actin-Tm interaction to a TnC-TnI interaction that likely enhances calcium binding by TnC.
Figures
Similar articles
-
Differences between cardiac and skeletal troponin interaction with the thin filament probed by troponin exchange in skeletal myofibrils.Biophys J. 2009 Jul 8;97(1):183-94. doi: 10.1016/j.bpj.2009.04.023. Biophys J. 2009. PMID: 19580756 Free PMC article.
-
Regulation of contraction in striated muscle.Physiol Rev. 2000 Apr;80(2):853-924. doi: 10.1152/physrev.2000.80.2.853. Physiol Rev. 2000. PMID: 10747208 Review.
-
The regulation of myosin binding to actin filaments by Lethocerus troponin.J Mol Biol. 2007 Oct 26;373(3):587-98. doi: 10.1016/j.jmb.2007.07.066. Epub 2007 Aug 14. J Mol Biol. 2007. PMID: 17868693 Free PMC article.
-
A kinetic model of troponin dissociation in relation to thin filament regulation in striated muscle.Math Biosci. 2012 Jul;238(1):32-7. doi: 10.1016/j.mbs.2012.03.008. Epub 2012 Mar 29. Math Biosci. 2012. PMID: 22465839
-
Troponin Revealed: Uncovering the Structure of the Thin Filament On-Off Switch in Striated Muscle.Biophys J. 2021 Jan 5;120(1):1-9. doi: 10.1016/j.bpj.2020.11.014. Epub 2020 Nov 20. Biophys J. 2021. PMID: 33221250 Free PMC article. Review.
Cited by
-
Comparative proteomic profiling of soleus, extensor digitorum longus, flexor digitorum brevis and interosseus muscles from the mdx mouse model of Duchenne muscular dystrophy.Int J Mol Med. 2013 Sep;32(3):544-56. doi: 10.3892/ijmm.2013.1429. Epub 2013 Jul 3. Int J Mol Med. 2013. PMID: 23828267 Free PMC article.
-
Fiber-Type Shifting in Sarcopenia of Old Age: Proteomic Profiling of the Contractile Apparatus of Skeletal Muscles.Int J Mol Sci. 2023 Jan 26;24(3):2415. doi: 10.3390/ijms24032415. Int J Mol Sci. 2023. PMID: 36768735 Free PMC article. Review.
-
Effect of Ca2+ binding properties of troponin C on rate of skeletal muscle force redevelopment.Am J Physiol Cell Physiol. 2010 Nov;299(5):C1091-9. doi: 10.1152/ajpcell.00491.2009. Epub 2010 Aug 11. Am J Physiol Cell Physiol. 2010. PMID: 20702687 Free PMC article.
-
Complex tropomyosin and troponin T isoform expression patterns in orbital and global fibers of adult dog and rat extraocular muscles.J Muscle Res Cell Motil. 2013 Aug;34(3-4):211-31. doi: 10.1007/s10974-013-9346-9. Epub 2013 May 23. J Muscle Res Cell Motil. 2013. PMID: 23700265
-
Differences between cardiac and skeletal troponin interaction with the thin filament probed by troponin exchange in skeletal myofibrils.Biophys J. 2009 Jul 8;97(1):183-94. doi: 10.1016/j.bpj.2009.04.023. Biophys J. 2009. PMID: 19580756 Free PMC article.
References
-
- Gordon AM, Homsher E, Regnier M. Regulation of contraction in striated muscle. Physiol. Rev. 2000;80:853–924. - PubMed
-
- Squire JM, Morris EP. A new look at thin filament regulation in vertebrate skeletal muscle. FASEB J. 1998;12:761–771. - PubMed
-
- Bremel RD, Weber A. Cooperation within actin filament in vertebrate skeletal muscle. Nature New Biol. 1972;238:97–101. - PubMed
-
- Moss RL, Lauer MR, Giulian GG, Greaser ML. Altered Ca2+ dependence of tension development in skinned skeletal muscle fibers following modification of troponin by partial substitution with cardiac troponin C. J. Biol. Chem. 1986;261:6096–6099. - PubMed
Publication types
MeSH terms
Substances
Grants and funding
LinkOut - more resources
Full Text Sources
Miscellaneous
