Review
. 2006 Sep 1;575(Pt 2):321-32.
doi: 10.1113/jphysiol.2006.115568. Epub 2006 Jul 20.

The complexity of the mammalian transcriptome

Affiliations
Review

The complexity of the mammalian transcriptome

Stefano Gustincich et al. J Physiol. .

Abstract

A comprehensive understanding of protein and regulatory networks is strictly dependent on the complete description of the transcriptome of cells. After the determination of the genome sequence of several mammalian species, gene identification is based on in silico predictions followed by evidence of transcription. Conservative estimates suggest that there are about 20,000 protein-encoding genes in the mammalian genome. In the last few years the combination of full-length cDNA cloning, cap-analysis gene expression (CAGE) tag sequencing and tiling arrays experiments have unveiled unexpected additional complexities in the transcriptome. Here we describe the current view of the mammalian transcriptome focusing on transcripts diversity, the growing non-coding RNA world, the organization of transcriptional units in the genome and promoter structures. In-depth analysis of the brain transcriptome has been challenging due to the cellular complexity of this organ. Here we present a computational analysis of CAGE data from different regions of the central nervous system, suggesting distinctive mechanisms of brain-specific transcription.


Figures

Figure 1
Figure 1. Example of integration CA GE and cDNA information
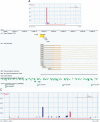
A, TSS and transcripts corresponding to the calcium-calmodulin-dependent protein kinase II, alfa (Camk2a) is presented. The x-axis for both panels are aligned and shows nucleotide postions along chromoose x in the mouse genome. The top panel shows TSS indicate by CAGE from visual cortex (Tropea et al. 2006) as a histogram (y axis indicate counts of CAGE tags at a given position) while the lower panel shows overlapping CAGE tags as a cluster (red arrows), cDNAs (grey-orange bars where grey indicate untranslated regions), and TUs (black line) B, CAGE library data set used for this study.
Figure 2
Figure 2. Differential promoter usage in brain tissues
A and B, examples of different promoter structures for a TU expressed in cerebellum. Histograms indicate the number of CAGE tags at given positions along the promoter, while the genome browser views show related genome and transcriptome features in the regions. A, The Calb1–Calbindin (Calb1) gene has a classic SP promoter, with TSS strongly associated to a TATA box. B, The Pleckstrin homology domain containing, family B (evectins) member 2 (Plekhb2) gene has a BR promoter, with TSS strongly associated with a CpG island. C and D, Example of shifts in TSS usage in the same promoter usage for two different brain tissues. CAGE tags distributions for the major promoter of the solute carrier family 17 (sodium-dependent inorganic phosphate cotransporter), member 7 (SIc17a7) gene are shown for visual cortex (A) and cerebellum (B). Note the large shift of TSS usage in cerebellum.
Figure 3
Figure 3. Examples of S–AS expression in the nervous system
Transcripts encoding Gnb5 are present in several brain tissues. AS transcripts were isolated from RIKEN full-length libraries made by olfactory brain RNA.
Figure 4
Figure 4. In depth analysis of TSS properties in brain tissues compared to liver
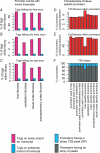
AC, overlap of CAGE tags (divided by tissue library and type of exons) and known exons from representative mRNA with > 2 exons. The first exon also includes 100 bp upstream of the exon. Tags (i) on the same strand as and (ii) antisense relative to exons are reported. Note that this assignment is not mutually exclusive for a given tag, as exons can overlap on opposite strands as well. There is a slightly higher level of antisense tags in the first exons in brain tissues compared with liver. Cerebellum libraries have an increase of tags falling into the last exon compared with other brain tissues. DF, analysis of promoter features. All TCs with at least 30 tags coming from the analysed libraries were analysed. For each tissue, promoter features were assessed for any promoter used in the tissue (at least one CAGE tag from the tissue in question), and promoters specific for the tissue (P < 0.01, Fisher's exact test). Brain tissues were assessed individually and also pooled and labelled ‘brain’. When assessing TSS distribution shape, promoters with sharp peaks were identified as in Carninci et al. (2006), while other promoters were considered ‘broad’.

Similar articles

Cited by

References

    1. Audic S, Claverie JM. The significance of digital gene expression profiles. Genome Res. 1997;7:986–995. - PubMed
    1. Babak T, Blencowe BJ, Hughes TR. A systematic search for new mammalian noncoding RNAs indicates little conserved intergenic transcription. BMC Genomics. 2005;6:104. - PMC - PubMed
    1. Bertone P, Stolc V, Royce TE, Rozowsky JS, Urban AE, Zhu X, et al. Global identification of human transcribed sequences with genome tiling arrays. Science. 2004;306:2242–2246. - PubMed
    1. Carninci P, Kasukawa T, Katayama S, Gough J, Frith MC, Maeda N, et al. FANTOM Consortium; RIKEN Genome Exploration Research Group and Genome Science Group (Genome Network Project Core Group) The transcriptional landscape of the mammalian genome. Science. 2005;309:1559–1563. - PubMed
    1. Carninci P, Sandelin A, Lenhard B, Katayama S, Shimokawa K, Ponjavic J, et al. Genome-wide analysis of mammalian promoter architecture and evolution. Nat Genet. 2006;38:626–635. - PubMed

Publication types

MeSH terms

LinkOut - more resources