. 2006 Oct 1;576(Pt 1):119-34.
doi: 10.1113/jphysiol.2006.115030. Epub 2006 Jul 20.

Alternative splicing in the C-terminus of CaV2.2 controls expression and gating of N-type calcium channels

Affiliations

Alternative splicing in the C-terminus of CaV2.2 controls expression and gating of N-type calcium channels

Andrew J Castiglioni et al. J Physiol. .

Abstract

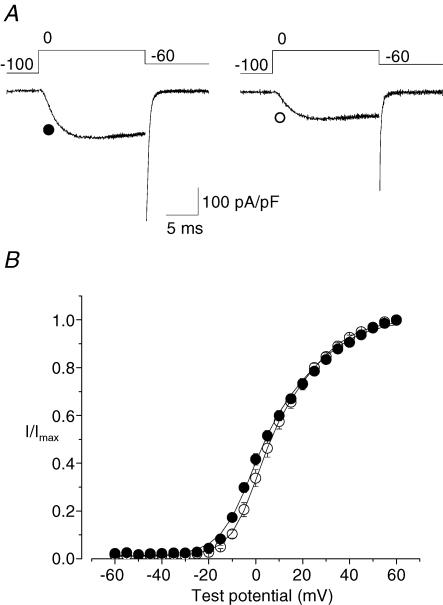
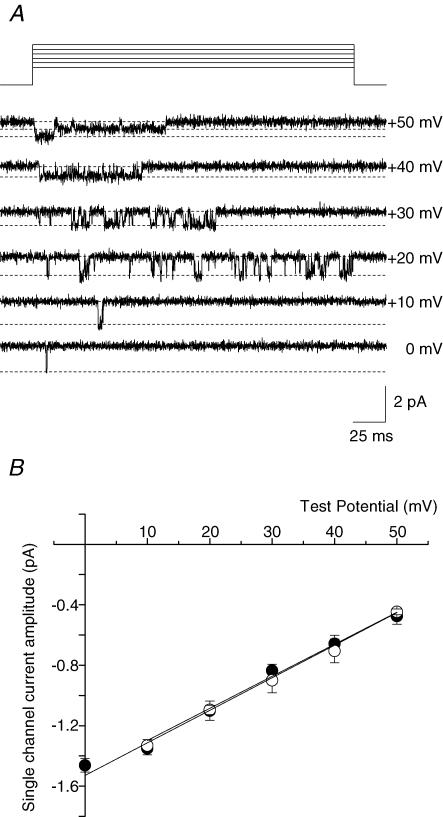
N-type Ca(V)2.2 calcium channels localize to presynaptic nerve terminals of nociceptors where they control neurotransmitter release. Nociceptive neurons express a unique set of ion channels and receptors important for optimizing their role in transmission of noxious stimuli. Included among these is a structurally and functionally distinct N-type calcium channel splice isoform, Ca(V)2.2e[37a], expressed in a subset of nociceptors and with limited expression in other parts of the nervous system. Ca(V)2.2[e37a] arises from the mutually exclusive replacement of e37a for e37b in the C-terminus of Ca(V)2.2 mRNA. N-type current densities in nociceptors that express a combination of Ca(V)2.2e[37a] and Ca(V)2.2e[37b] mRNAs are significantly larger compared to cells that express only Ca(V)2.2e[37b]. Here we show that e37a supports increased expression of functional N-type channels and an increase in channel open time as compared to Ca(V)2.2 channels that contain e37b. To understand how e37a affects N-type currents we compared macroscopic and single-channel ionic currents as well as gating currents in tsA201 cells expressing Ca(V)2.2e[37a] and Ca(V)2.2e[37b]. When activated, Ca(V)2.2e[37a] channels remain open for longer and are expressed at higher density than Ca(V)2.2e[37b] channels. These unique features of the Ca(V)2.2e[37a] isoform combine to augment substantially the amount of calcium that enters cells in response to action potentials. Our studies of the e37a/e37b splice site reveal a multifunctional domain in the C-terminus of Ca(V)2.2 that regulates the overall activity of N-type calcium channels in nociceptors.


Figures

Figure 1
Figure 1. CaV2.2 contains mutually exclusive exons 37a and 37b
A, exons 37a and 37b are located adjacent to IVS6 at the proximal end of the CaV2.2 C-terminus. B, CaV2.2 mRNA contains either e37a or e37b. C, exons 37a and e37b differ by 14 amino acids. D, CaV2.2e[37a] mRNA is expressed in adult dorsal root ganglia (DRG) and adult brain. In DRG, CaV2.2e[37a] transcripts represent 5.9 ± 0.2% (DRG from eight animals) of all CaV2.2 mRNA, and in brain, CaV2.2e[37a] transcripts represent 1.8 ± 0.2% (brains from three animals) of all CaV2.2 mRNA. The mean percentages of e37a represent data from three individual hybridizations. The means are significantly different (P < 0.05).
Figure 9
Figure 9. CaV2.2e[37a] channels carry more current when activated by action potentials recorded from nociceptors
Whole-cell calcium currents recorded from tsA201 cells activated by action potential waveforms as command voltages. A–C, upper panels, individual current traces obtained from six different tsA201 cells expressing CaV2.2e[37a] (e37a) or CaV2.2e[37b] (e37b) using action potentials triggered by brief current pulses recorded from three different neurons. The resting potential of each neuron used to record each action potential is indicated. D, left panel, individual current traces from cells expressing CaV2.2e[37a] (e37a) and CaV2.2e[37b] (e37b). Traces are offset on the x-axis so that they can be distinguished. The command voltage shown above current traces is a train of action potentials recorded from a nociceptor induced by exposure to 500 nm capsaicin. A–C, lower panels and D, right panel, comparison of average total charge transferred for each isoform, normalized by cell capacitance, for each data set. n values are indicated in parentheses. Mean values are significantly different (*P < 0.05).
Figure 10
Figure 10. CaV2.2e[37a] channels carry more current when activated by action potentials recorded from central neurons
Whole-cell calcium currents recorded from tsA201 cells activated by action potential waveforms as command voltages. A and B, upper panels, individual current traces recorded from four different tsA201 cells expressing CaV2.2e[37a] (e37a) or CaV2.2e[37b] (e37b). Command voltages shown above current traces. A, a train of two spontaneous action potentials (1, 2) recorded from a dopaminergic substantia nigra neuron. Current traces are offset slightly on the x-axis so that they can be distinguished. B, a single action potential recorded from a CA1 hippocampal neuron induced by a brief current pulse. A and B, lower panels, average total charge transferred for each isoform, normalized by cell capacitance, are compared for each data set; n values are indicated in parentheses. Mean values are significantly different (*P < 0.05).
Figure 2
Figure 2. Exon 37a increases CaV2.2 current density
A, CaV2.2e[37a] whole-cell currents evoked by steps from −40 to +110 mV from a holding potential of −100 mV (left). Representative inward currents at +10 mV (centre) and outward currents at +100 mV (right) of CaV2.2e[37a] (•) and CaV2.2e[37b] (○). B, Whole-cell current–voltage relationships of CaV2.2e[37a] (•, n = 20) and CaV2.2e[37b] (○, n = 21). Peak inward current densities are −217.1 ± 26.5 pA pF−1 at +10 mV for CaV2.2e[37a] and −129.1 ± 13.3 pA pF−1 at +15 mV for CaV2.2e[37b]. Significant differences (P < 0.05) exist between the current density values of each isoform from −20 to +50 mV and from +90 to +110 mV. Curves between −60 and +60 mV are fitted with a Boltzmann–Goldman–Hodgkin–Katz function. Curves between +60 and +110 mV are fitted with a single exponential. The estimated activation mid-point values (V½) for each isoform are significantly different (P < 0.05). The estimated slope factor (k) values and reversal potentials for each isoform are not significantly different. V½ values are 0.2 ± 0.4 mV and 4.1 ± 0.5 mV, k values are 4.9 ± 0.1 mV and 5.3 ± 0.2 mV, and reversal potentials are 59.9 ± 0.6 mV and 59.5 ± 1.0 mV for CaV2.2e[37a] and CaV2.2e[37b], respectively. C, ratio of mean e37a and e37b peak current densities from B plotting a ratio value for all test potentials with a difference between mean current densities. The dotted line indicates a ratio of one.
Figure 3
Figure 3. CaV2.2e[37a] and CaV2.2e[37b] channels activate at similar voltages
A, representative whole-cell currents from a cell expressing CaV2.2e[37a] channels and a cell expressing CaV2.2e[37b] channels. Tail currents were measured at −60 mV following a depolarizing test pulse to 0 mV. B, activation curves required the sum of two Boltzmann functions that had V½ values of ∼0 and ∼20 mV (Lin et al. 2004). An insufficient number of data points, however, define the second Boltzmann function making it difficult to obtain accurate estimates of the first Boltzmann in an unconstrained fit of the data. Fits shown were therefore obtained by constraining parameters of the second Boltzmann function for each individual data set. Parameters of the second Boltzmann function represented the overall average amplitude of 0.5, with V½ = 20 mV and k = 12 mV. Average values for parameters of the first Boltzmann obtained from the best fit to the data were for CaV2.2e[37a] (•, n = 13), V½ = – 3.3 ± 1.0 mV and k = 5.6 ± 0.5 mV, and for CaV2.2e[37b] (○, n = 10), V½ = 1.3± 1.7 mV and k = 5.5 ± 0.6 mV. V½ values are significantly different (P < 0.05), k values are not significantly different (P > 0.05).
Figure 4
Figure 4. CaV2.2e[37a] channels take longer to deactivate and are slower to inactivate
A, left panel, tail currents from the cells shown in Fig. 3A normalized to peak tail current, and overlaid starting from the time of peak tail current. Tail current decays are fitted best with a single exponential. Right panel, time constants of deactivation (τdeact) are significantly different (P < 0.05) and are 0.40 ± 0.03 ms for CaV2.2e[37a] channels (•, n = 13) and 0.26 ± 0.05 ms for CaV2.2e[37b] channels (○, n = 9). Individual τdeact values are shown along with the mean value (larger circle). B, left panel, representative currents each normalized to peak current. Currents were generated by a square pulse depolarization to 0 mV from a holding potential of −100 mV. Inactivating currents are best fitted with a single exponential. Right panel, mean time constants of inactivation (τinact) values are significantly different (P < 0.05) and are 76.4 ± 11.0 ms for CaV2.2e[37a]-expressing cells (•, n = 5) and 41.2 ± 6 ms for CaV2.2e[37b]-expressing cells (○, n = 8). Individual τinact values are shown along with the mean value (larger circle).
Figure 5
Figure 5. CaV2.2e[37a] and CaV2.2e[37b] channels do not differ in their single-channel conductance
A, representative single-channel openings from a patch containing CaV2.2e[37a] channels. Channels were activated by steps to 0, +10, +20, +30, +40 and +50 mV from a holding potential of −80 mV. B, average single-channel current–voltage relationships. Single-channel conductance values were determined per patch by linear regression and are 21.6 ± 0.2 pS (•, n = 4) for CaV2.2e[37a] channels and 21.2 ± 1.6 pS (○, n = 3) for CaV2.2e[37b] channels.
Figure 6
Figure 6. CaV2.2e[37a] channels open for longer durations
A, representative single-channel openings (10 contiguous sweeps) from a patch containing CaV2.2e[37a] channels. Channels were activated by a step to +20 mV from a holding potential of −100 mV. The lower panel shows the open-time distribution (1-ms bin) of all sweeps from the same individual patch as the representative openings. B, same as A but for an individual patch containing CaV2.2e[37b] channels. Open-time distributions are best fitted with one exponential. The time constants of open-time distribution (τopen) and the mean open times are significantly different (P < 0.05) between isoforms. τopen values are 1.51 ± 0.09 ms for CaV2.2e[37a] channels (•, n = 7) and 1.12 ± 0.05 ms for CaV2.2e[37b] channels (○, n = 7). Mean open times are 1.79 ± 0.12 ms for CaV2.2e[37a] channels and 1.26 ± 0.05 ms for CaV2.2e[37b] channels. Insets show histograms using the same X-axis (0–15 ms) but a different y-axis that only extends to 1000 events per 1-ms bin to illustrate the different open-time distributions between isoforms.
Figure 7
Figure 7. Cells expressing CaV2.2e[37a] channels displace more gating charge
A, whole-cell currents from a cell expressing CaV2.2e[37a] showing the change in the ON gating currents at the reversal potential (+62.0 mV in this cell) following steps to various potentials (−100, −60, −10, +10 and +100 mV shown) from a holding potential of −100 mV. B, expanded ON gating currents at the reversal potential after a preceding step to −100 mV for a cell expressing CaV2.2e[37a] (•) and a cell expressing CaV2.2e[37b] (○). The decay of the gating current fitted with a single exponential and the time constant is the same for both isoforms (CaV2.2e[37a], 0.50 ± 0.01 ms, n = 18; CaV2.2e[37b], 0.53 ± 0.01 ms, n = 18). C, average total charge movement during ON gating current as a function of the preceding potential step for CaV2.2e[37a] (•, n = 18) and CaV2.2e[37b] (○, n = 18). The average charge moved is significantly different (P < 0.05) between the two isoforms from −100 to −60 mV. The curves are fitted with a Boltzmann function and the asymptotes at the hyperpolarized potentials are significantly different (P < 0.05): CaV2.2e[37a], 22.7 ± 1.0 fC pF−1; CaV2.2e[37b], 15.5 ± 0.6 fC pF−1. The other parameters from the individual fits are not significantly different. The asymptotes at depolarized potentials are 0.03 ± 0.09 fC pF−1 and −0.15 ± 0.08 fC pF−1, V½ values are −12.3 ± 2.4 mV and −7.4 ± 2.0 mV, and k values are 10.3 ± 1.3 mV and 8.0 ± 1.2 mV for CaV2.2e[37a] and CaV2.2e[37b], respectively.
Figure 8
Figure 8. The relationship between whole-cell conductance and gating charge moved is identical
Gmaxversus Qmax relationship for CaV2.2e[37a] (•, n = 17) and CaV2.2e[37b] (○, n = 16). The data from each isoform were fitted by linear regression. The slopes and the y-axis intercepts are not significantly different between the two isoforms. The slopes (Gmax/Qmax) are 0.20 ± 0.02 nS fC−1 and 0.20 ± 0.03 nS fC−1, the y-axis intercepts are 6.37 ± 4.23 nS and 5.17 ± 5.50 nS, and r2 values are 0.89 and 0.80 for CaV2.2e[37a] and CaV2.2e[37b], respectively.

Comment in

Similar articles

Cited by

References

    1. Agler HL, Evans J, Tay LH, Anderson MJ, Colecraft HM, Yue DT. G protein-gated inhibitory module of N-type (ca(v)2.2) ca2+ channels. Neuron. 2005;46:891–904. - PubMed
    1. Altier C, Khosravani H, Evans RM, Hameed S, Peloquin JB, Vartian BA, et al. ORL1 receptor-mediated internalization of N-type calcium channels. Nat Neurosci. 2006;9:31–40. - PubMed
    1. Altier C, Zamponi GW. Targeting Ca2+ channels to treat pain: T-type versus N-type. Trends Pharmacol Sci. 2004;25:465–470. - PubMed
    1. Bell TJ, Thaler C, Castiglioni AJ, Helton TD, Lipscombe D. Cell-specific alternative splicing increases calcium channel current density in the pain pathway. Neuron. 2004;41:127–138. - PubMed
    1. Bezanilla F. The voltage sensor in voltage-dependent ion channels. Physiol Rev. 2000;80:555–592. - PubMed

Publication types

MeSH terms