. 2006 Nov 15;108(10):3477-83.
doi: 10.1182/blood-2006-04-015743. Epub 2006 Jul 20.

Plasma inhibitory activity (PIA): a pharmacodynamic assay reveals insights into the basis for cytotoxic response to FLT3 inhibitors

Affiliations

Plasma inhibitory activity (PIA): a pharmacodynamic assay reveals insights into the basis for cytotoxic response to FLT3 inhibitors

Mark Levis et al. Blood. .

Abstract

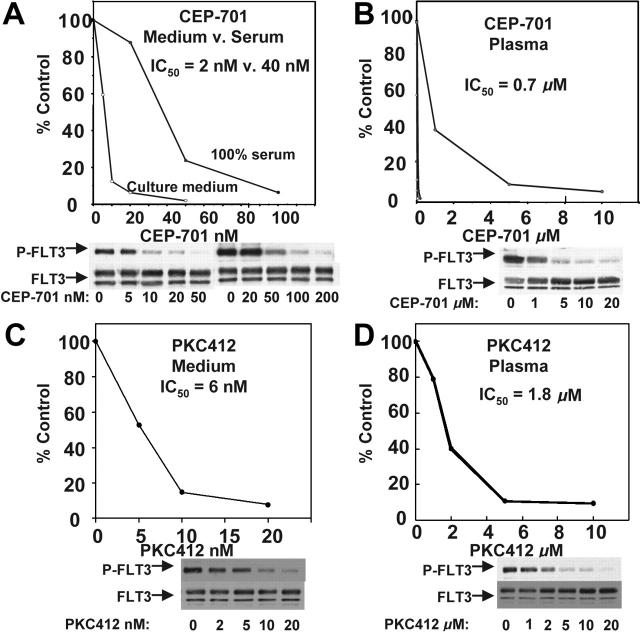
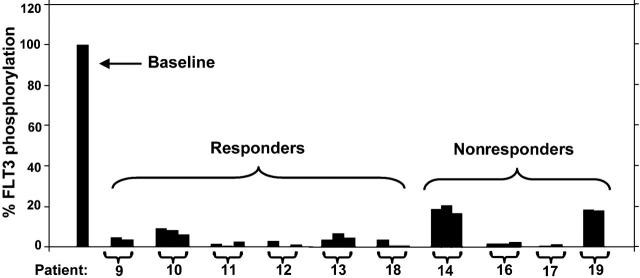
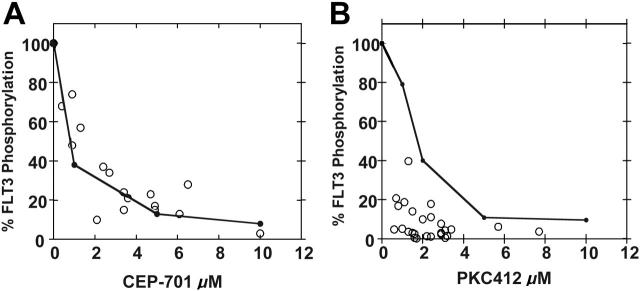
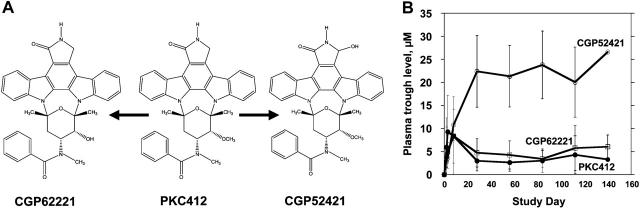
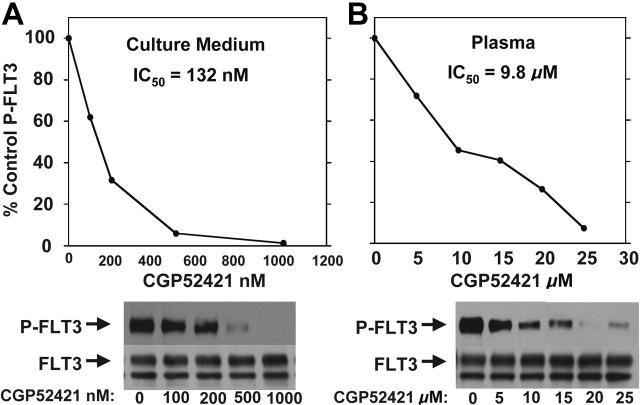
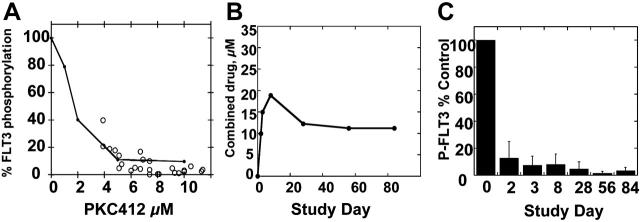
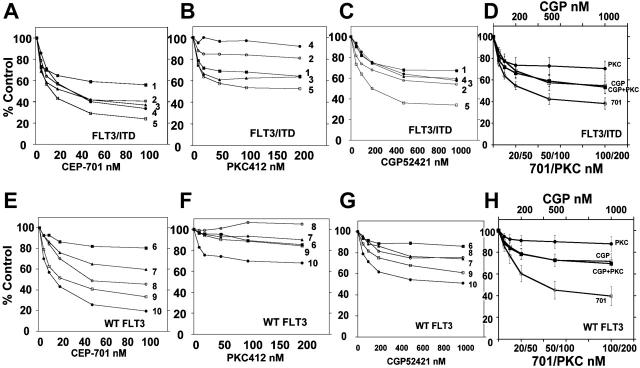
We have developed a useful surrogate assay for monitoring the efficacy of FLT3 inhibition in patients treated with oral FLT3 inhibitors. The plasma inhibitory activity (PIA) for FLT3 correlates with clinical activity in patients treated with CEP-701 and PKC412. Using the PIA assay, along with in vitro phosphorylation and cytotoxicity assays in leukemia cells, we compared PKC412 and its metabolite, CGP52421, with CEP-701. While both drugs could effectively inhibit FLT3 in vitro, CEP-701 was more cytotoxic to primary samples at comparable levels of FLT3 inhibition. PKC412 appears to be more selective than CEP-701 and therefore less effective at inducing cytotoxicity in primary acute myeloid leukemia (AML) samples in vitro. However, the PKC412 metabolite CGP52421 is less selective than its parent compound, PKC412, and is more cytotoxic against primary blast samples at comparable levels of FLT3 inhibition. The plasma inhibitory activity assay represents a useful correlative tool in the development of small-molecule inhibitors. Our application of this assay has revealed that the metabolite CGP52421 may contribute a significant portion of the antileukemia activity observed in patients receiving oral PKC412. Additionally, our results suggest that nonselectivity may constitute an important component of the cytotoxic effect of FLT3 inhibitors in FLT3-mutant AML.


Figures

Figure 1.
Figure 1.
FLT3 inhibition by CEP-701 and PKC412 in culture medium compared with plasma. TF/ITD cells were incubated with the indicated concentrations of drug for 2 hours, and then FLT3 was immunoprecipitated from cell lysates and resolved by electrophoresis as described in “Patients, materials, and methods,” under “FLT3 phosphorylation.” Immunoblots were probed with antiphosphotyrosine and then stripped and reprobed with anti-FLT3. Densitometry results from the immunoblots were plotted as percent untreated. The calculated IC50 values shown were derived using linear regression analysis. (A) CEP-701, medium versus serum. (B) CEP-701, plasma. (C) PKC412, medium versus serum. (D) PKC412, plasma.
Figure 2.
Figure 2.
PIA assay for FLT3 using plasma samples from patients treated with PKC412. Trough plasma samples from 10 patients receiving 75 mg PKC412 orally every 8 hours were used in a PIA assay for FLT3. The results are expressed as percent baseline. Each bracket marks a set of samples from the same patient, and the patient numbers correspond to the numbering used by Stone et al. For each patient, PIA results from day 3, day 8, and day 28 of treatment with PKC412 are shown. A day-8 sample was not available for patient 9, and a day-28 sample was not available for patient 19. For some samples,, some of the columns are not visible because FLT3 phosphorylation was completely suppressed.
Figure 3.
Figure 3.
PIA for FLT3 plotted against plasma drug levels. Shown are the standard curves (solid black lines) for inhibition of FLT3 autophosphorylation in plasma by CEP-701 (A) and PKC412 (B). These are the same curves from Figure 1B,D. Superimposed over the curves are PIA assay results (○) for individual samples from patients treated with CEP-701 (A) and PKC412 (B). Each circle plots the level of FLT3 phosphorylation in the PIA assay against the measurement of the actual drug level from that plasma sample.
Figure 4.
Figure 4.
PKC412 and metabolites. (A) CGP6221 and CGP52421 are generated from PKC412 via P450 liver enzyme metabolism.17 (B) Trough plasma concentrations of PKC412 (•), CGP62221 (□), and CGP52421 (○) averaged for patients treated with 75 mg PKC412 orally every 8 hours. Error bars represent standard deviations.
Figure 5.
Figure 5.
CGP52421 inhibition of FLT3 autophosphorylation in culture medium compared with plasma. TF/ITD cells were incubated with the indicated concentrations of CGP52421 in culture medium with 10% FBS (A) or plasma (B) for 2 hours and then analyzed for FLT3 autophosphorylation as in Figure 1.
Figure 6.
Figure 6.
PIA assay results compared with combined PKC412, CGP6221, and CGP52421 levels. (A) Standard curve for inhibition of FLT3 autophosphorylation by PKC412 in plasma (Figures 1D and 3B). Superimposed over this graph are PIA assay results (○) plotted against the “adjusted” PKC412 level, calculated by adding the concentration of PKC412 and CGP6221 and value of the CGP52421 level divided by 5.4. (B) The average “adjusted” concentrations of PKC412 for patients on the PKC412 trial. (C) PIA results, averaged for each time point, for patients on the PKC412 trial. Error bars represent standard deviations.
Figure 7.
Figure 7.
Cytotoxicity assays for CEP-701, PKC412, and CGP52421. MTT assays were performed on 10 primary AML samples, 5 with FLT3/ITD mutations and 5 with wild-type FLT3. (A-C) FLT3/ITD samples tested against increasing concentrations of CEP-701, PKC412, and CGP52421. (E-G) Samples with wild-type FLT3 tested against increasing concentrations of CEP-701, PKC412, and CGP52421. (D) Four dose-response curves are shown. Three represent the combined results of the values obtained in the experiments shown in panels A-C for the 3 drugs CEP-701, PKC412, and CGP52421 as single agents (error bars depict SEM). The fourth curve, which virtually overlaps the CGP52421 curve, represents the results when these same samples were exposed to an increasing concentration of CGP52421 in the presence of a fixed concentration of PKC412 (10 nM) so as to mimic the presence of both compounds found in plasma simultaneously. (H) As in panel D, using wild-type FLT3 samples.

References

    1. Levis M, Small D. FLT3: ITDoes matter in leukemia. Leukemia. 2003;17: 1738-1752. - PubMed
    1. Levis M, Small D. FLT3 tyrosine kinase inhibitors. Int J Hematol. 2005;82: 100-107. - PubMed
    1. Smith BD, Levis M, Beran M, et al. Single-agent CEP-701, a novel FLT3 inhibitor, shows biologic and clinical activity in patients with relapsed or refractory acute myeloid leukemia. Blood. 2004;103: 3669-3676. - PubMed
    1. Stone RM, DeAngelo DJ, Klimek V, et al. Patients with acute myeloid leukemia and an activating mutation in FLT3 respond to a small-molecule FLT3 tyrosine kinase inhibitor, PKC412. Blood. 2005;105: 54-60. - PubMed
    1. Levis M, Smith BD, Beran M, et al. A randomized, open-label study of lestaurtinib (CEP-701), an oral FLT3 inhibitor, administered in sequence with chemotherapy in patients with relapsed AML harboring FLT3 activating mutations: clinical response correlates with successful FLT3 inhibition [abstract]. Blood. 2005;106: 121a. Abstract 403.

Publication types

MeSH terms