

Lineage-specific activators affect beta-globin locus chromatin in multipotent hematopoietic progenitors
- PMID: 16858401
- PMCID: PMC1538551
- DOI: 10.1038/sj.emboj.7601232
Lineage-specific activators affect beta-globin locus chromatin in multipotent hematopoietic progenitors
Abstract
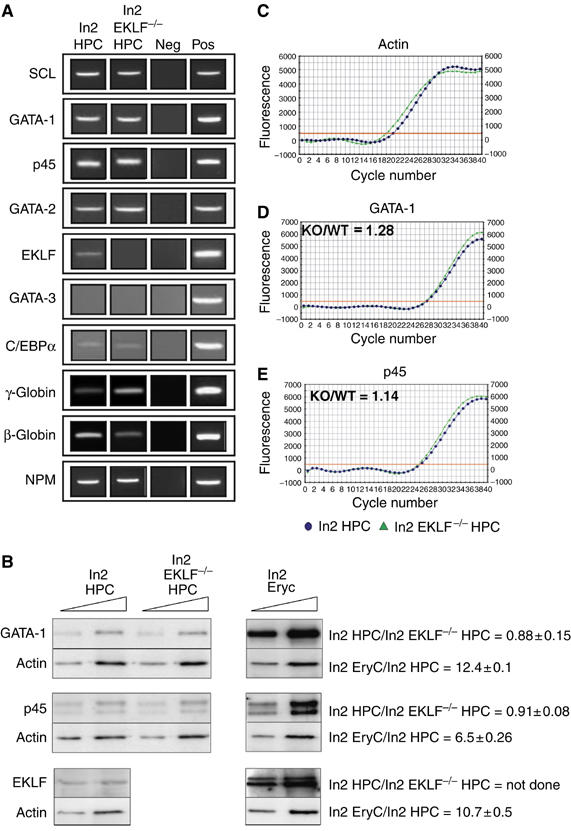
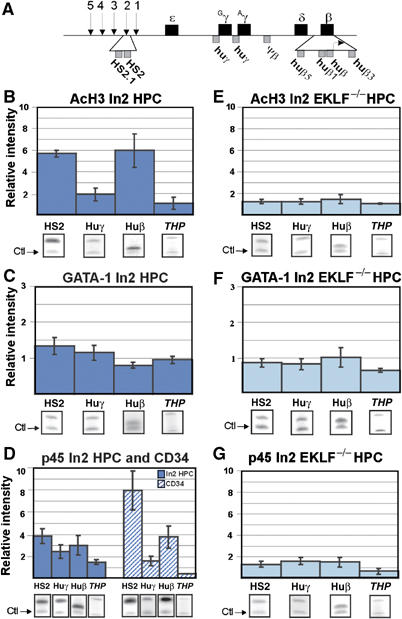
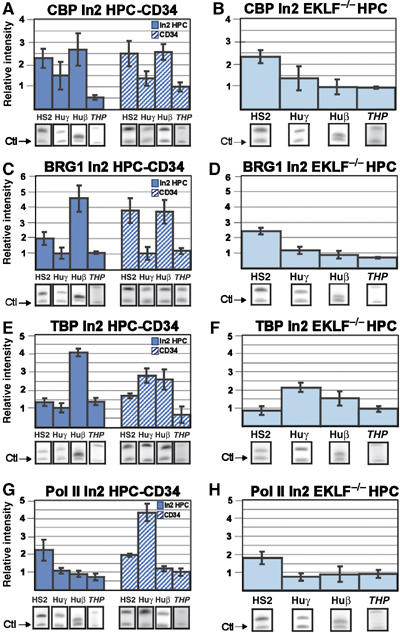
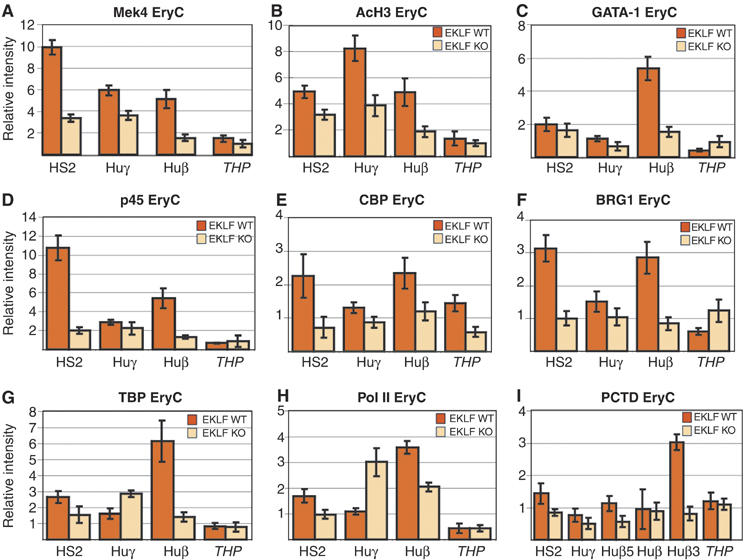
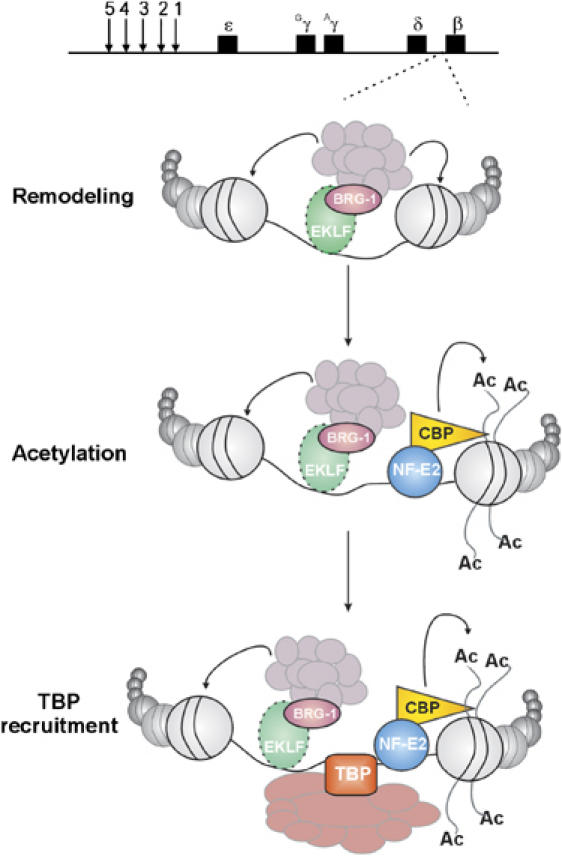
During development, the regulated expression of tissue-specific genes can be preceded by their potentiation, that is, by chromatin activation in progenitor cells. For example, the human beta-like globin genes are potentiated in a gene- and developmental-specific manner in hematopoietic progenitors. Developmental regulation of human beta-gene expression in erythroid cells is mostly determined by transcriptional activators; however, it is not clear how gene-specific potentiation is set in hematopoietic progenitors. Using human and transgenic multipotent hematopoietic progenitors, we demonstrate that human beta-globin locus activation is characterized by TBP, NF-E2, CBP and BRG1 recruitment at both the Locus Control Region and human beta-gene promoter. Our results further indicate that in hematopoietic progenitors, EKLF influences chromatin organization at the human beta-globin locus and is instrumental for human beta-gene potentiation. Thus, we show that lineage-specific transcriptional activators expressed at basal levels in progenitor cells can participate in gene potentiation.
Figures

Similar articles
-
A major role for the TATA box in recruitment of chromatin modifying complexes to a globin gene promoter.Proc Natl Acad Sci U S A. 2003 Jun 10;100(12):7009-14. doi: 10.1073/pnas.1236499100. Epub 2003 May 28. Proc Natl Acad Sci U S A. 2003. PMID: 12773626 Free PMC article.
-
Chromatin-binding in vivo of the erythroid kruppel-like factor, EKLF, in the murine globin loci.Cell Res. 2006 Apr;16(4):347-55. doi: 10.1038/sj.cr.7310045. Cell Res. 2006. PMID: 16617330
-
Sumoylation of p45/NF-E2: nuclear positioning and transcriptional activation of the mammalian beta-like globin gene locus.Mol Cell Biol. 2005 Dec;25(23):10365-78. doi: 10.1128/MCB.25.23.10365-10378.2005. Mol Cell Biol. 2005. PMID: 16287851 Free PMC article.
-
Role of intergenic human gamma-delta-globin sequences in human hemoglobin switching and reactivation of fetal hemoglobin in adult erythroid cells.Ann N Y Acad Sci. 2005;1054:48-54. doi: 10.1196/annals.1345.057. Ann N Y Acad Sci. 2005. PMID: 16339651 Review.
-
Progress toward the genetic treatment of the beta-thalassemias.Ann N Y Acad Sci. 2005;1054:78-91. doi: 10.1196/annals.1345.010. Ann N Y Acad Sci. 2005. PMID: 16339654 Review.
Cited by
-
Dissecting the function of the adult β-globin downstream promoter region using an artificial zinc finger DNA-binding domain.Nucleic Acids Res. 2014 Apr;42(7):4363-74. doi: 10.1093/nar/gku107. Epub 2014 Feb 4. Nucleic Acids Res. 2014. PMID: 24497190 Free PMC article.
-
Chromatin remodeling subunit BRM and valine regulate hematopoietic stem/progenitor cell function and self-renewal via intrinsic and extrinsic effects.Leukemia. 2022 Mar;36(3):821-833. doi: 10.1038/s41375-021-01426-8. Epub 2021 Oct 1. Leukemia. 2022. PMID: 34599272 Free PMC article.
-
Locus control region mediated regulation of adult beta-globin gene expression.J Cell Biochem. 2008 Sep 1;105(1):9-16. doi: 10.1002/jcb.21820. J Cell Biochem. 2008. PMID: 18500726 Free PMC article.
-
Haploinsufficiency for the erythroid transcription factor KLF1 causes hereditary persistence of fetal hemoglobin.Nat Genet. 2010 Sep;42(9):801-5. doi: 10.1038/ng.630. Epub 2010 Aug 1. Nat Genet. 2010. PMID: 20676099 Free PMC article.
-
Severe anemia in the Nan mutant mouse caused by sequence-selective disruption of erythroid Kruppel-like factor.Proc Natl Acad Sci U S A. 2010 Aug 24;107(34):15151-6. doi: 10.1073/pnas.1004996107. Epub 2010 Aug 9. Proc Natl Acad Sci U S A. 2010. PMID: 20696915 Free PMC article.
References
-
- Agalioti T, Chen G, Thanos D (2002) Deciphering the transcriptional histone acetylation code for a human gene. Cell 111: 381–392 - PubMed
-
- Akashi K, Traver D, Miyamoto T, Weissman IL (2000) A clonogenic common myeloid progenitor that gives rise to all myeloid lineages. Nature 404: 193–197 - PubMed
-
- Amrolia PJ, Ramamurthy L, Saluja D, Tanese N, Jane SM, Cunningham JM (1997) The activation domain of the enhancer binding protein p45NF-E2 interacts with TAFII130 and mediates long-range activation of the alpha- and beta-globin gene loci in an erythroid cell line. Proc Natl Acad Sci USA 94: 10051–10056 - PMC - PubMed
-
- Andrews NC, Erdjument-Bromage H, Davidson MB, Tempst P, Orkin SH (1993) Erythroid transcription factor NF-E2 is a haematopoietic-specific basic-leucine zipper protein. Nature 362: 722–728 - PubMed
Publication types
MeSH terms
Substances
LinkOut - more resources
Full Text Sources
Medical
Miscellaneous
