. 2006 Nov 7;243(1):98-113.
doi: 10.1016/j.jtbi.2006.05.030. Epub 2006 Jun 7.

A continuum approach to modelling cell-cell adhesion

Affiliations

A continuum approach to modelling cell-cell adhesion

Nicola J Armstrong et al. J Theor Biol. .

Abstract

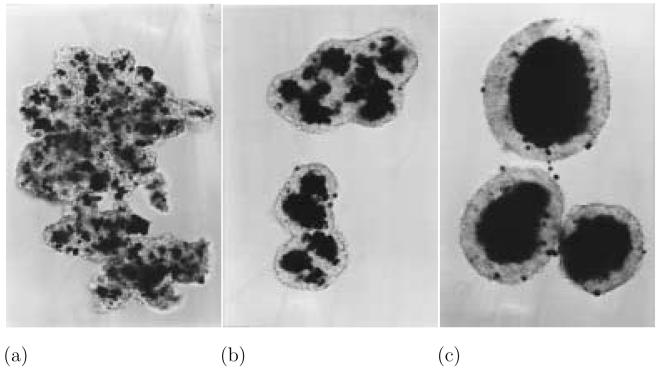
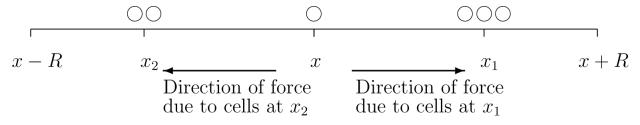
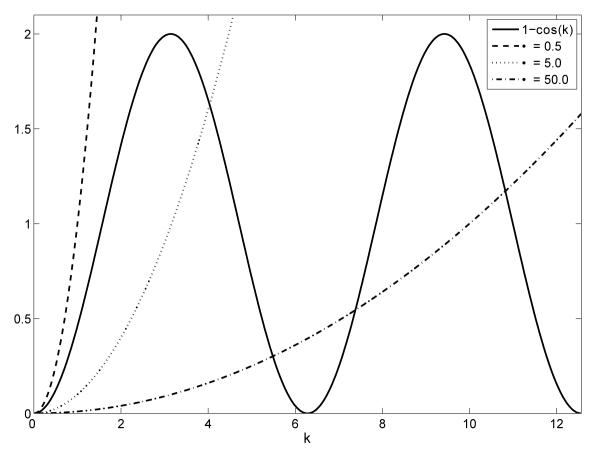
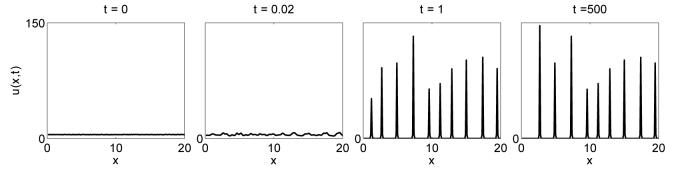
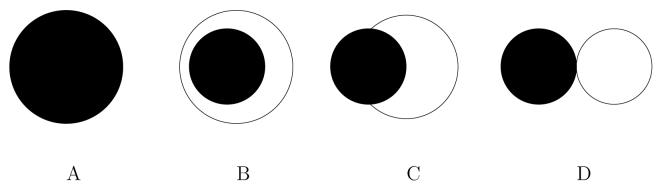
Cells adhere to each other through the binding of cell adhesion molecules at the cell surface. This process, known as cell-cell adhesion, is fundamental in many areas of biology, including early embryo development, tissue homeostasis and tumour growth. In this paper we develop a new continuous mathematical model of this phenomenon by considering the movement of cells in response to the adhesive forces generated through binding. We demonstrate that our model predicts the aggregation behaviour of a disassociated adhesive cell population. Further, when the model is extended to represent the interactions between multiple populations, we demonstrate that it is capable of replicating the different types of cell sorting behaviour observed experimentally. The resulting pattern formation is a direct consequence of the relative strengths of self-population and cross-population adhesive bonds in the model. While cell sorting behaviour has been captured previously with discrete approaches, it has not, until now, been observed with a fully continuous model.


Figures

Fig. 1
Fig. 1
Illustrative figures of cell adhesion and sorting showing aggregations observed in experiments mixing 7 day old chick embryo neural retinal cells (light cells) and pigmented retinal epithelial cells (dark cells). (a) After 5 hours cells form randomly mixed aggregates. (b) After 19 hours the pigmented retinal cells are almost exclusively located in the interior of the aggregates. (c) After 2 days the pigmented retinal cells have formed central masses, completely surrounded by the neural retinal cells. The few pigmented cells seen on the surface are thought to be dead cells. (From Armstrong (1971), courtesy of P.B. Armstrong.)
Fig. 2
Fig. 2
A schematic illustration of cell movement under an attractive force towards cells at position x.
Fig. 3
Fig. 3
An illustration of the inequality, (3.6). We let the initial population density across the domain be U = 1. The solid line curve is the right hand side of (3.6), 1 − cos(k). The other three lines are plots of the left hand side of (3.6), k2/2αU, for three values of α. We can see that for α = 0.5 there is no region where the inequality holds and so aggregations will not occur. When α = 5.0 and α = 50.0 aggregations are possible for wavenumbers in regions where the solid line is above the dotted and dash-dotted line respectively. This indicates the importance of the adhesion strength on the model behaviour.
Fig. 4
Fig. 4
Confirmation that aggregating behaviour can be seen in this model under certain parameter assumptions. The model, (3.1), is solved on a domain of length 20 discretised into 200 mesh points. Here we choose α = 10. Initially the cell population is distributed evenly across the domain. With time the system evolves into a pattern of peaks showing aggregations of cells.
Fig. 5
Fig. 5
A plot of the left hand side of inequality (4.4) as a function of k showing that there are values of k where the inequality holds and hence wavenumbers for which aggregations are possible. The initial cell density is taken to be N = 1, and the adhesion parameters are Su = 3.0, Sv = 1.0 and C = 0.3
Fig. 6
Fig. 6
Confirmation of aggregations in the two population model in one dimension. The model is solved on a domain of length 20, discretised into 200 mesh points. The model parameters are set at Su = 25, Sv = 7.5 and (a) C = 0.0, (b) C = 12.5. We can see in (a) that separate aggregations occur when there is no interaction between cell types. In (b) there are interactions between cell types. Aggregations occur but we are unable to distinguish between the cell populations as all cells aggregate in the same spatial regions.
Fig. 7
Fig. 7
The possible configurations to which a system of two cell populations may evolve. The more cohesive population, u, is shown here in black and the less cohesive population, v, in white. Su, Sv and C represents the cohesive strength of population u, the cohesive strength of population v and the cross-population adhesive strength respectively. A: Mixing (Preferential cross adhesion). The cross adhesion strength of the cells is greater than the average of the two self adhesion strengths, C>Su+Sv2. The cells form mixed population aggregates. B: Engulfment (Intermediate cross adhesion). The cross adhesion strength is greater than the self adhesion strength of the less cohesive population but less than the self adhesion strength of the more cohesive population, Sv < C < Su. The more cohesive population is engulfed by the less cohesive population. C: Partial Engulfment (Relatively weak adhesion). The cross adhesion strength is less than both the self adhesion strengths, C < Su and C < Sv. The more cohesive population is partially engulfed by the less cohesive population. D: Complete Sorting (No cross adhesion). If there is no cross adhesion between the two populations and C = 0 the two cell types form separate aggregations. (Figure adapted from Foty and Steinberg (2004).)
Fig. 8
Fig. 8
Aggregations in the two population logistic model in one dimension. Parameters are set at Su = 25, Sv = 7.5 and C = 0.0, corresponding to scenario D in figure 7. The model is solved on a domain of length 20, discretised into 200 mesh points. This is a repeat of the simulation shown in figure 6(a) with the introduction of a logistic form for g(u, v). By comparison the aggregations are smoother, cover a larger spatial area and have a lower maximum density than those in figure 6(a). In addition cell sorting is now seen.
Fig. 9
Fig. 9
The results of numerical simulations in one dimension using adhesive strengths relating to the experiments by Steinberg (1962c). In each case the model is solved on a domain of length 20, discretised into 200 mesh points. Initial conditions are shown along with the pattern formation seen at time steps t = 5, t = 10 and finally at t = 500. Results (A)-(D) use the adhesion properties detailed in figure 7. (A):Mixing, Su = 25, Sv = 7.5 and C = 22.5. (B):Engulfment, Su = 250, Sv = 25 and C = 50. (C):Partial Engulfment, Su = 25, Sv = 25 and C = 12.5. (D):Complete Sorting, Su = 25, Sv = 7.5 and C = 0.0.
Fig. 10
Fig. 10
An illustration of aggregating behaviour in the two dimensional model for one cell population. The model is solved on a domain of size 5×5 which is discretised into 50×50 mesh points. The adhesion strength of the cells is assumed to be linear with respect to cell density, g(u) = u, and constant with respect to radial distance, Ω(r) = 1.0. We choose the adhesion strength parameter to be α = 1. In these panels cell density from zero to 2 is shown on a scale running from white to black. All densities greater than 2 are shown in black. We can see that with time the system evolves from an almost homogeneous distribution to a pattern of aggregations.
Fig. 11
Fig. 11
Confirmation that aggregating behaviour is possible in the model for two populations in two dimensions. The model is solved on a domain of size 10×10, discretised into 50×50 mesh points. Here u density is shown in blue, v density is shown in red and regions where both cell types are present are green/yellow depending on the relative densities of u and v. At t = 0 there is a mixture of cells across the domain. At t = 3.75 some reorganisation of cells can be observed. At t = 25 there is evidence of pattern formation and by t = 125 the cells have sorted into two overlapping aggregations. The adhesion strength parameters here are set at Su = 10, Sv = 10 and C = 5, corresponding to scenario C in figure 7.
Fig. 12
Fig. 12
The results of numerical simulations in two dimensions using adhesive strengths relating to the experiments by Steinberg (1962c). In each case the model is solved on a domain of size 10×10, discretised into 50×50 mesh points. Results (a)-(d) use the adhesion properties detailed in figure 7. (a):Mixing, Su = 10, Sv = 3 and C = 9. (b):Engulfment, Su = 100, Sv = 10 and C = 20. (c):Partial Engulfment, Su = 10, Sv = 10 and C = 5. (d):Complete Sorting, Su = 10, Sv = 3 and C = 0.

Similar articles

Cited by

References

    1. Anderson ARA. A hybrid model of solid tumour invasion: the importance of cell adhesion. Mathematical Medicine and Biology. 2005;22:163–186. - PubMed
    1. Armstrong PB. Light and electron microscope studies of cell sorting in combinations of chick embryo neural retina and retinal pigment epithelium. Wilhelm Roux' Archiv. 1971;168:125–141. - PubMed
    1. Byrne H, Chaplain M. Modelling the role of cell-cell adhesion in the growth and development of carcinomas. Mathematical and Computer Modelling. 1996;24(12):1–17.
    1. Drasdo D, Forgacs G. Modeling the interplay of generic and genetic mechanisms in cleavage, blastulation, and gastrulation. Dev Dyn. 2000;219:182–191. - PubMed
    1. Drasdo D, Hohme S. A single-cell-based model of tumor growth in vitro: monolayers and spheroids. Phys Biol. 2005 Sep;2(3):133–147. - PubMed

Publication types

LinkOut - more resources