

Diversity of the T-cell response to pulmonary Cryptococcus neoformans infection
- PMID: 16861640
- PMCID: PMC1539621
- DOI: 10.1128/IAI.00080-06
Diversity of the T-cell response to pulmonary Cryptococcus neoformans infection
Abstract
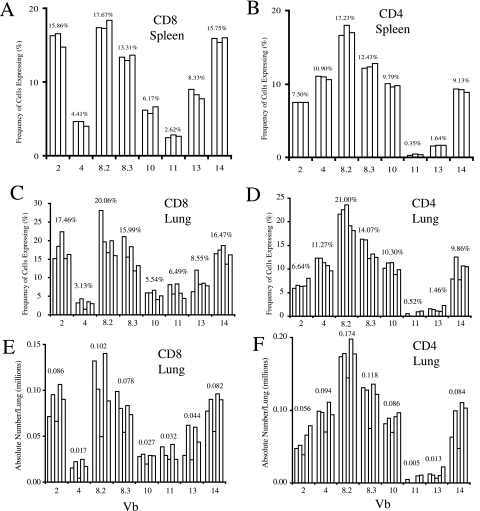
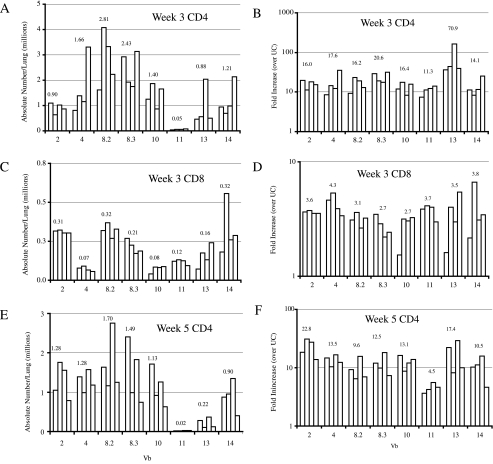
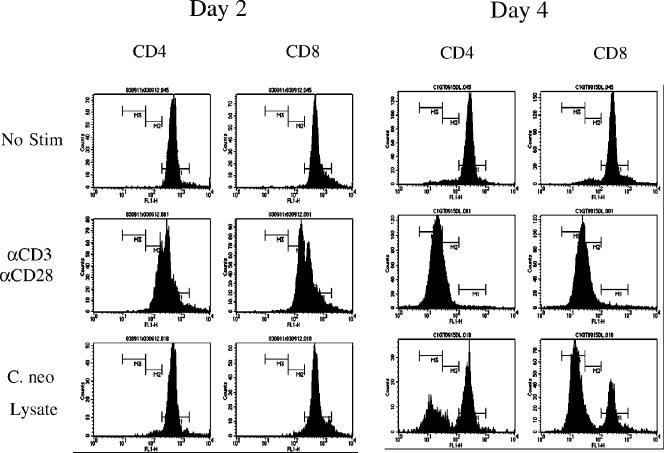
Cell-mediated immunity plays an important role in immunity to the pathogenic fungus Cryptococcus neoformans. However, the antigen specificity of the T-cell response to C. neoformans remains largely unknown. In this study, we used two approaches to determine the antigen specificity of the T-cell response to C. neoformans. We report here that a diverse T-cell receptor (TCR) Vbeta repertoire was maintained throughout the primary response to pulmonary C. neoformans infection in immunocompetent mice. CD4+ T-cell deficiency resulted in relative expansion of all CD8+ T-cell subsets. During a secondary immune response, preferential usage of a TCR Vbeta subset in CD4+ T cells occurred in single individuals, but the preferences were "private" and not shared between individuals. Both CD4+ and CD8+ T cells from the secondary lymphoid tissues of immunized mice proliferated in response to a variety of C. neoformans antigens, including heat-killed whole C. neoformans, culture filtrate antigen, C. neoformans lysate, and purified cryptococcal mannoprotein. CD4+ and CD8+ T cells from the secondary lymphoid tissues of mice undergoing a primary response to C. neoformans proliferated in response to C. neoformans lysate. In response to stimulation with C. neoformans lysate, lung CD4+ and CD8+ T cells produced the effector cytokines tumor necrosis factor alpha and gamma interferon. These results demonstrate that a diverse T-cell response is generated in response to pulmonary C. neoformans infection.
Figures


Similar articles
-
Generation of antifungal effector CD8+ T cells in the absence of CD4+ T cells during Cryptococcus neoformans infection.J Immunol. 2005 Jun 15;174(12):7920-8. doi: 10.4049/jimmunol.174.12.7920. J Immunol. 2005. PMID: 15944298
-
Distinct compartmentalization of CD4+ T-cell effector function versus proliferative capacity during pulmonary cryptococcosis.Am J Pathol. 2006 Mar;168(3):847-55. doi: 10.2353/ajpath.2006.050522. Am J Pathol. 2006. PMID: 16507900 Free PMC article.
-
Evaluation of host immune responses to pulmonary cryptococcosis using a temperature-sensitive C. neoformans calcineurin A mutant strain.Microb Pathog. 2005 Feb-Mar;38(2-3):113-23. doi: 10.1016/j.micpath.2004.12.007. Microb Pathog. 2005. PMID: 15748813
-
Regulation by innate immune T lymphocytes in the host defense against pulmonary infection with Cryptococcus neoformans.Jpn J Infect Dis. 2004 Aug;57(4):137-45. Jpn J Infect Dis. 2004. PMID: 15329444 Review.
-
Role of dendritic cell-pathogen interactions in the immune response to pulmonary cryptococcal infection.Future Microbiol. 2015;10(11):1837-57. doi: 10.2217/fmb.15.92. Future Microbiol. 2015. PMID: 26597428 Free PMC article. Review.
Cited by
-
Loss of allergen 1 confers a hypervirulent phenotype that resembles mucoid switch variants of Cryptococcus neoformans.Infect Immun. 2009 Jan;77(1):128-40. doi: 10.1128/IAI.01079-08. Epub 2008 Oct 27. Infect Immun. 2009. PMID: 18955480 Free PMC article.
-
State of the Field: Cytotoxic Immune Cell Responses in C. neoformans and C. deneoformans Infection.J Fungi (Basel). 2024 Oct 12;10(10):712. doi: 10.3390/jof10100712. J Fungi (Basel). 2024. PMID: 39452664 Free PMC article. Review.
-
Disseminated Cryptococcosis with Rapidly Growing Lung Nodules in an End-stage Renal Disease Patient.Intern Med. 2017;56(3):377-380. doi: 10.2169/internalmedicine.56.7438. Epub 2017 Feb 1. Intern Med. 2017. PMID: 28154287 Free PMC article.
-
Adaptive Immunity to Cryptococcus neoformans Infections.J Fungi (Basel). 2017;3(4):64. doi: 10.3390/jof3040064. Epub 2017 Nov 21. J Fungi (Basel). 2017. PMID: 29333430 Free PMC article.
-
The magnitude of CD4(+) T-cell activation rather than TCR diversity determines the outcome of Leishmania infection in mice.Parasite Immunol. 2011 Mar;33(3):170-80. doi: 10.1111/j.1365-3024.2010.01268.x. Parasite Immunol. 2011. PMID: 21306400 Free PMC article.
References
-
- Acha-Orbea, H., and H. R. MacDonald. 1995. Superantigens of mouse mammary tumor virus. Annu. Rev. Immunol. 13:459-486. - PubMed
-
- Belz, G. T., W. Xie, and P. C. Doherty. 2001. Diversity of epitope and cytokine profiles for primary and secondary influenza a virus-specific CD8+ T cell responses. J. Immunol. 166:4627-4633. - PubMed
-
- Bentley, G. A., and R. A. Mariuzza. 1996. The structure of the T cell antigen receptor. Annu. Rev. Immunol. 14:563-590. - PubMed
-
- Casadevall, A., and J. R. Perfect. 1998. Cryptococcus neoformans. ASM Press, Washington, D.C.
Publication types
MeSH terms
Substances
Grants and funding
LinkOut - more resources
Full Text Sources
Research Materials
