. 2006 Aug 17;442(7104):772-8.
doi: 10.1038/nature04979. Epub 2006 Jul 19.

A genomic code for nucleosome positioning

Affiliations

A genomic code for nucleosome positioning

Eran Segal et al. Nature. .

Abstract

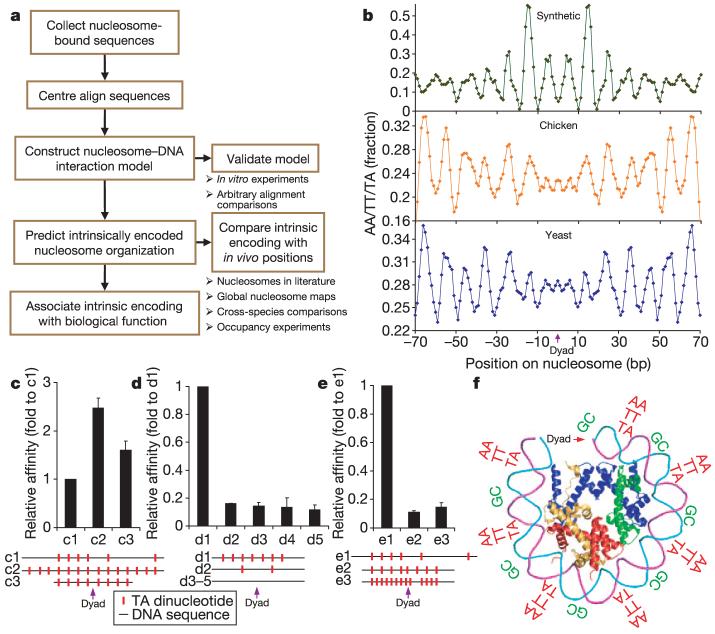
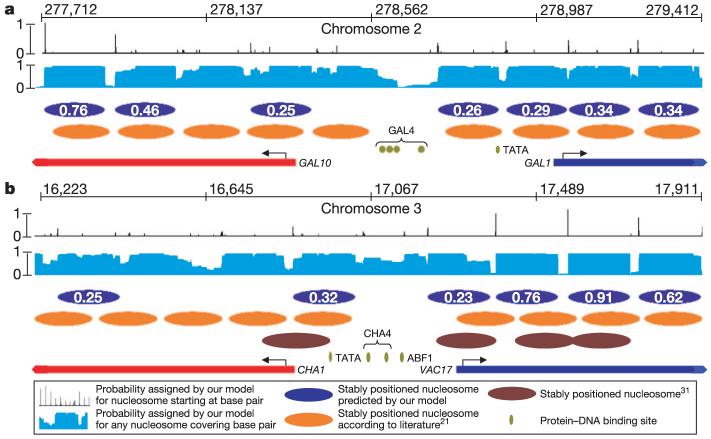
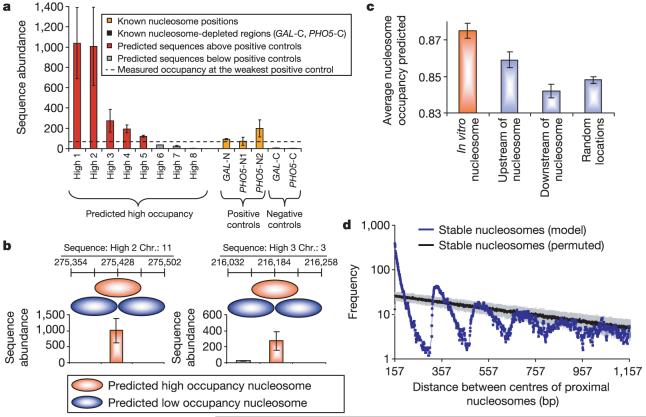
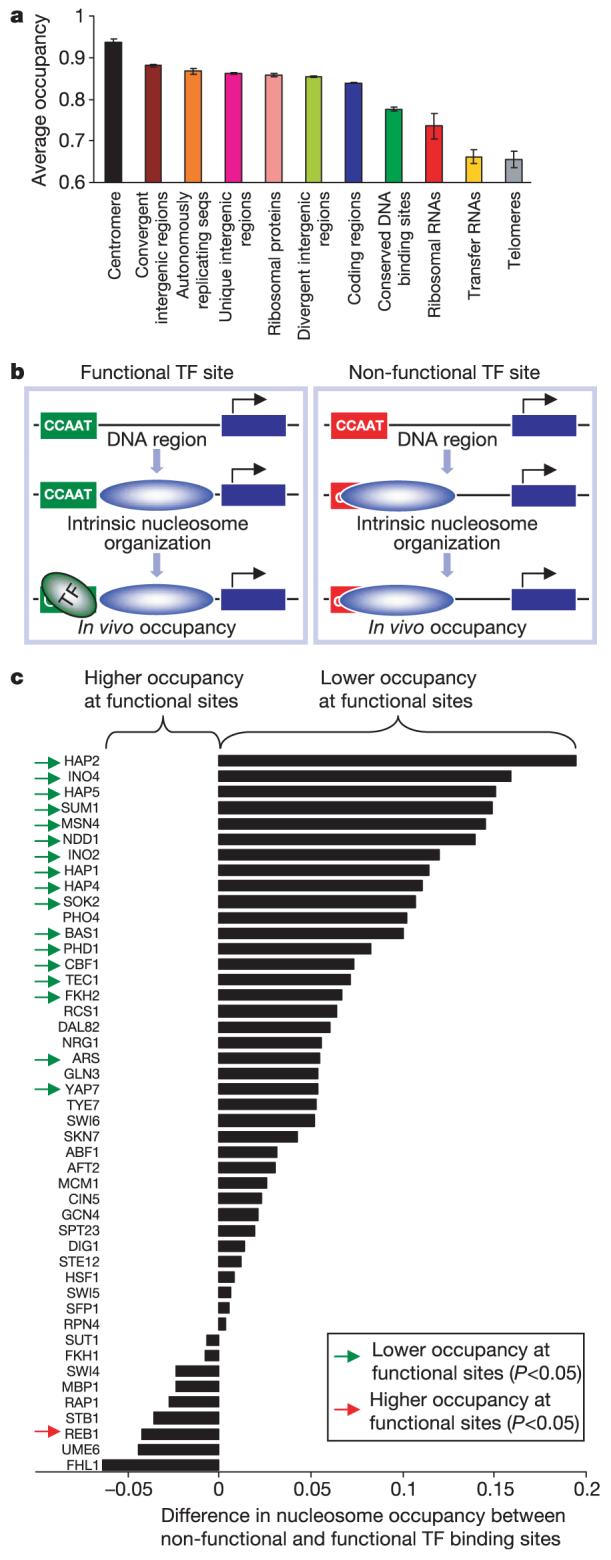
Eukaryotic genomes are packaged into nucleosome particles that occlude the DNA from interacting with most DNA binding proteins. Nucleosomes have higher affinity for particular DNA sequences, reflecting the ability of the sequence to bend sharply, as required by the nucleosome structure. However, it is not known whether these sequence preferences have a significant influence on nucleosome position in vivo, and thus regulate the access of other proteins to DNA. Here we isolated nucleosome-bound sequences at high resolution from yeast and used these sequences in a new computational approach to construct and validate experimentally a nucleosome-DNA interaction model, and to predict the genome-wide organization of nucleosomes. Our results demonstrate that genomes encode an intrinsic nucleosome organization and that this intrinsic organization can explain approximately 50% of the in vivo nucleosome positions. This nucleosome positioning code may facilitate specific chromosome functions including transcription factor binding, transcription initiation, and even remodelling of the nucleosomes themselves.


Figures

Figure 1
Figure 1. Probabilistic nucleosome-DNA interaction model
a, Flow chart illustrating our approach. b, Fraction (3-bp moving average) of AA/TT/TA dinucleotides at each position of centre-aligned yeast, chicken or random chemically synthesized nucleosome-bound DNA sequences, showing ∼10-bp periodicity of these dinucleotides. c-e, In vitro experiments. Positions of the key AA/TT/TA dinucleotides on the tested sequences are indicated. Error bars are s.e.m. c, Nucleosome binding affinities of sequences c2 and c3 (ref. 44), which include additional dinucleotide motifs at key positions, relative to the affinity of c1. d, Sequences d2-d5 have dinucleotide motifs removed from key positions in e1. e, Sequences e2 and e3 have disrupted spacing between the key dinucleotide motifs. f, Key dinucleotides inferred from the alignments are shown relative to the three-dimensional structure of one-half of the symmetric nucleosome.
Figure 2
Figure 2. Genome-wide prediction of intrinsic nucleosome organization and comparison to literature-reported, experimentally identified nucleosome positions
a, Detailed view of the GAL1-10 locus, with literature-reported nucleosome positions (orange ovals). Black trace, probability of a nucleosome starting at each base pair; blue ovals, high probability nucleosomes predicted from our model (probability is indicated); light-blue trace, average occupancy by any nucleosome at each base pair; red and blue bars, protein-coding regions; green ovals, conserved and bound DNA-binding sites. b, Same as in a, but for the CHA1 locus; brown ovals, nucleosomes reported from other experiments. The discrepancies between the two sets of literature-reported nucleosome positions highlight the uncertainty in such measurements.
Figure 3
Figure 3. Higher-order features of intrinsic nucleosome organization and comparison with in vivo occupancy experiments
a, Experimentally measured nucleosome occupancy in vivo for eight high-occupancy predictions, compared with high- and low-occupied locations in the GAL1-10 and PHO5 promoters. Error bars are s.d. b, In vivo nucleosome occupancy measured at predicted low-occupancy regions that are one-half nucleosome distance upstream and downstream (light blue) from the high-occupancy (orange) predictions of a. See Supplementary Fig. 31 for additional measurements. Results of a and b were consistent when normalized for the sequence specificity of micrococcalnuclease (Supplementary Fig. 32). Error bars are s.d. c, Predicted nucleosome occupancy in intergenic regions for nucleosomes obtained from an in vitro selection experiment (orange) compared with predicted nucleosome occupancy in immediately upstream or downstream locations, or to random genomic locations (light blue). Error bars are s.e.m. d, Number of all pairs of proximal stable nucleosomes per centre-to-centre nucleosome distance, compared to the mean (black) and standard deviation (grey) in 100 permutations. Blue, yeast model (stability probability ≥0.5).
Figure 4
Figure 4. Intrinsic nucleosome occupancy varies with genomic location type and is low at functional transcription factor binding sites
a, Average occupancies and standard errors for different types of genomic regions. b, Schematic illustrating how the intrinsic nucleosome organization may facilitate binding of transcription factors (TF) at functional sites, while disfavouring binding at identical non-functional sites that occur by chance. c, Difference in predicted nucleosome occupancy between non-functional and functional transcription factor binding sites (absolute occupancy levels are shown in Supplementary Fig. 36). Green arrows, 17 factors having significantly lower nucleosome occupancy at functional sites compared with non-functional sites; red arrow, 1 factor having significantly higher nucleosome occupancy at non-functional sites compared with functional sites.
Figure 5
Figure 5. Genomes encode unstable nucleosomes at transcriptional start sites
a, Average across all yeast genes of the in vivo occupancy of nucleosomes containing the histone variant H2A.Z (green) or of canonical nucleosomes (red), compared to the nucleosome occupancy predicted by our yeast nucleosome model (blue); all versus distance from the translation open reading frame (ORF) start site. The ORF-proximal peak of our model is statistically significant (Supplementary Fig. 37). b, The most probable nucleosome organization, based on a. Each nucleosome (ovals; labels represent nucleosome centres) is centred to a corresponding peak in a. Bottom graph shows distribution of TATA boxes relative to ORF start sites; brown oval is median TATA box location.

Comment in

  • Genomics: predictable packaging.
    Richmond TJ. Richmond TJ. Nature. 2006 Aug 17;442(7104):750-2. doi: 10.1038/442750a. Nature. 2006. PMID: 16915272 No abstract available.

References

    1. Richmond TJ, Davey CA. The structure of DNA in the nucleosome core. Nature. 2003;423:145–150. - PubMed
    1. Satchwell SC, Drew HR, Travers AA. Sequence periodicities in chicken nucleosome core DNA. J. Mol. Biol. 1986;191:659–675. - PubMed
    1. Widom J. Role of DNA sequence in nucleosome stability and dynamics. Q. Rev. Biophys. 2001;34:269–324. - PubMed
    1. van Holde KE. Chromatin. Springer; New York: 1989.
    1. Jenuwein T, Allis CD. Translating the histone code. Science. 2001;293:1074–1080. - PubMed

Publication types