. 2006 Jul 31;174(3):437-45.
doi: 10.1083/jcb.200604113. Epub 2006 Jul 24.

To stabilize neutrophil polarity, PIP3 and Cdc42 augment RhoA activity at the back as well as signals at the front

Affiliations

To stabilize neutrophil polarity, PIP3 and Cdc42 augment RhoA activity at the back as well as signals at the front

Alexandra Van Keymeulen et al. J Cell Biol. .

Abstract

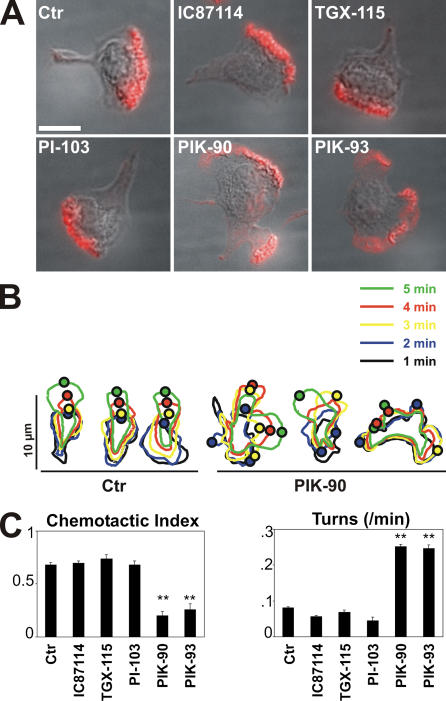
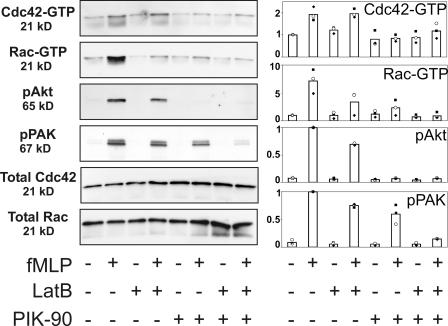
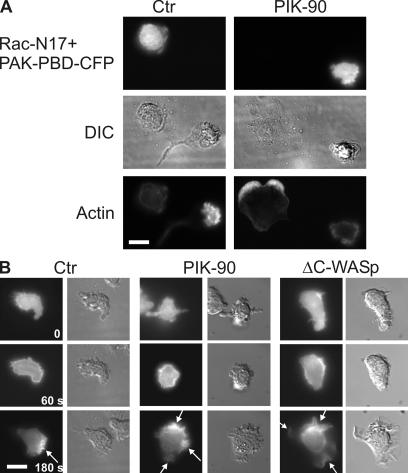
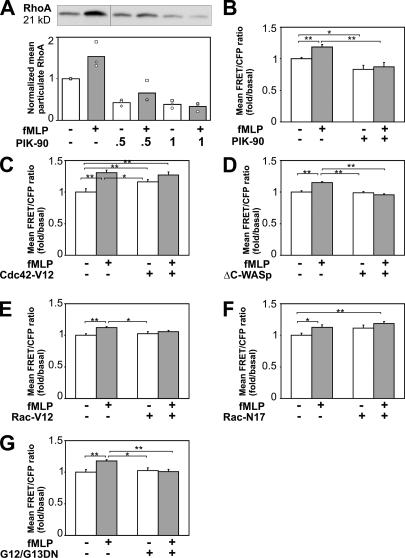
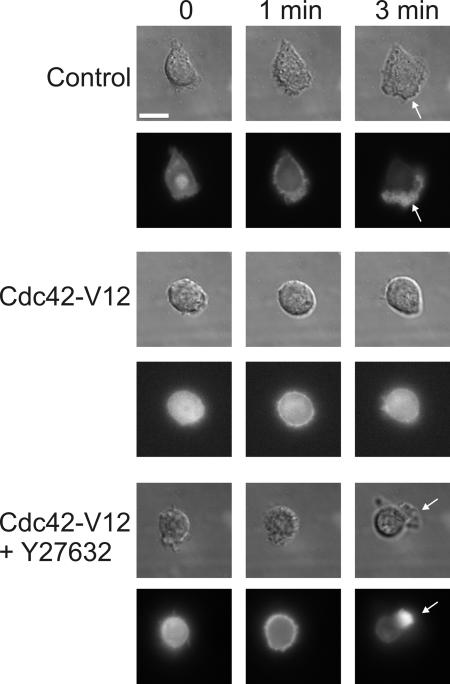
Chemoattractants like f-Met-Leu-Phe (fMLP) induce neutrophils to polarize by triggering divergent signals that promote the formation of protrusive filamentous actin (F-actin; frontness) and RhoA-dependent actomyosin contraction (backness). Frontness locally inhibits backness and vice versa. In neutrophil-like HL60 cells, blocking phosphatidylinositol-3,4,5-tris-phosphate (PIP3) accumulation with selective inhibitors of PIP3 synthesis completely prevents fMLP from activating a PIP3-dependent kinase and Cdc42 but not from stimulating F-actin accumulation. PIP3-deficient cells show reduced fMLP-dependent Rac activity and unstable pseudopods, which is consistent with the established role of PIP3 as a mediator of positive feedback pathways that augment Rac activation at the front. Surprisingly, such cells also show reduced RhoA activation and RhoA-dependent contraction at the trailing edge, leading to the formation of multiple lateral pseudopods. Cdc42 mediates PIP3's positive effect on RhoA activity. Thus, PIP3 and Cdc42 maintain stable polarity with a single front and a single back not only by strengthening pseudopods but also, at longer range, by promoting RhoA-dependent actomyosin contraction at the trailing edge.


Figures

Figure 1.
Figure 1.
Effects of PI3K inhibitors on polarity and chemotaxis. (A) Cellular distribution of F-actin. Cells in suspension were exposed for 40 min either to no drugs, to 10 μM IC87114 or TGX-115, or to 1 μM PI-103, PIK-90, and PIK-93, allowed to stick to coverslips for 15 min, and treated with 100 nM fMLP for 3 min before fixation and staining for F-actin (red), as described in Materials and methods. Fluorescent and differential interference contrast images are merged. (Note that fMLP induced the formation of more than one leading edge in the individual cells shown for PIK-90 and -93, but this effect was not seen in all cells; see Results and Table S3) Bar, 10 μm. (B) Outlines of cells responding to stimulation with a uniform concentration of 100 nM fMLP. Cells were treated with or without 1 μM PIK-90 before treatment with fMLP. Each set of outlines represents a single cell observed at 1-min intervals (denoted by colors as indicated) after exposure to fMLP. Each small circle represents the center of a protruding lamellum at the periphery of each cell at the indicated time. Outlines on the left or right represent three control (Ctr) or three PIK-90–treated cells, respectively. Time-lapse videos of representative control or PIK-90–treated cells are shown in the supplemental material (Videos 1 and 2, respectively). (C) CI (left) and turning frequency of cells treated with the compounds indicated. Each bar represents the mean + one SEM (error bars) of different numbers of cells that were tested in multiple experiments: 30 control cells and 20, 10, 10, 29, and 18 cells for the compounds IC87114, TGX-115, PI-103, PIK-90, and PIK-93, respectively; concentrations of the same compounds were 10, 10, 0.5, 0.5, and 0.5 μm, respectively. Asterisks indicate that the value for cells treated with the compound differs from the corresponding control by P < 0.001. Trajectories of chemotaxing cells treated with two of these inhibitors are shown in Fig. S2 C (available at http://www.jcb.org/cgi/content/full/jcb.200604113/DC1).
Figure 2.
Figure 2.
Effects of PIK-90 and LatB on the fMLP-stimulated activities of Rac and Cdc42 and the phosphorylation of Akt and PAK. Cells received no pretreatment or were exposed for 40 min to 40 μg/ml LatB, 0.5 μM PIK-90, or both and were stimulated with 100 nM fMLP for 1 min as indicated. Incubations were terminated, and lysates were prepared as indicated in Materials and methods. Rac-GTP (isoforms 1 and 2) and Cdc42-GTP were assessed by a GST-PAK-PBD pull-down assay; total Rac, pAkt, and pPAK were measured by immunoblotting aliquots of the lysate used for the pull-down reaction (see Materials and methods). The left panel shows representative blots for each condition. The right panel shows quantification of the immunoblots, which were measured with the Image program (Scion). The y axis represents immunoblot intensities (arbitrary scales). For each immunoblot, the background signal was subtracted and all values were normalized: for Cdc42-GTP and Rac-GTP, values were normalized to the signal (=1.0) detected in the absence of fMLP or inhibitor; and for pAkt and pPAK, values were normalized to the fMLP-dependent signal (=1.0) detected in the absence of inhibitor. Each graph represents the mean of three independent experiments, with different symbols representing the three actual values. Total Cdc42 and Rac in these extracts, which were not affected by PIK-90 or LatB, were used to check for equal loading in the different lanes.
Figure 3.
Figure 3.
Effects of PIK-90 and Cdc42 inhibition on the localization of Rac activity in pseudopods. (A) Cellular distribution of F-actin in Rac-N17–expressing cells. Cells transiently coexpressing Rac-N17 and PAK-PBD-CFP were exposed for 40 min to no drugs or 1 μM PIK-90, allowed to stick to coverslips for 15 min, and treated with 100 nM fMLP for 3 min before fixation and staining for F-actin, as described in Materials and methods. Each set of pictures shows one cell expressing the fluorescent marker and one untransfected cell. (B) Cells expressing PAK-PBD-CFP pretreated in suspension with or without 1 μM PIK-90 for 40 min or cells coexpressing PAK-PBD-CFP and ΔC-WASp were allowed to stick to a coverslip for 15 min and were exposed to a uniform concentration of 100 nM fMLP. Images show the time course of response of a single control, a PIK-90–treated cell, and a ΔC-WASp–expressing cell at the times indicated after the addition of fMLP. Arrows point to pseudopods. Bars, 10 μm.
Figure 4.
Figure 4.
RhoA activation depends on PI3Kγ and Cdc42. (A) fMLP-induced membrane association of RhoA. Cells received no pretreatment or were exposed for 40 min to 0.5 or 1 μM of PIK-90 as indicated and were stimulated with or without 100 nM fMLP for 1 min as indicated. RhoA that associated with the particulate fraction of cell extracts was then assessed as described in Materials and methods. The top and bottom panels show a representative immunoblot and quantification of immunoblotted bands measured with the Image program (Scion), respectively. For each immunoblot, the background signal was subtracted, and the level of RhoA was normalized to that of transferrin in the particulate fraction; all values were further normalized to the signal detected in the absence of inhibitor, which was set at 1.0. Each graph represents the mean of three independent experiments, with different symbols representing the three actual values. (B–G) Quantification of mean FRET/CFP ratios in cells treated under different conditions. Data were obtained from n ≥ 25, 14, 18, 12, 13, or 13 cells in B–G, respectively, and were normalized to the FRET/CFP signal measured in unstimulated control cells. Similar results were observed in three independent experiments. Error bars indicate one SEM. t tests were performed to compare data of unstimulated control versus other experimental groups and between stimulated control and other conditions. Pairs of treatments that showed a statistically significant difference are marked with asterisks (*, P ≤ 0.05; **, P ≤ 0.001 by t test). (B) Lentivirus-transformed cells expressing the RhoA biosensor were treated with or without 1 μM PIK-90 for 40 min, stimulated with 100 nM fMLP for 3 min as indicated, fixed, and subjected to FRET imaging. (C–G). dHL60 cells transiently transfected with the RhoA biosensor and Cdc42-V12, ΔC-WASp, Rac-V12, Rac-N17, or G12/G12-DN, as indicated, were stimulated with 100 nM fMLP for 3 min as indicated.
Figure 5.
Figure 5.
Treatment with the ROCK inhibitor Y27632 partially rescues the Cdc42-V12 phenotype. Cells were transiently transfected with YFP-actin alone (control) or YFP-actin plus Cdc42-V12. After 4 h, cells were allowed to adhere to the coverslip in the presence of 10 μM Y27632 (for 20 min). Differential interference contrast and the corresponding fluorescent images are shown. Cells were then uniformly stimulated with 100 nM fMLP. Time after fMLP addition is indicated. Arrows point to pseudopods. Bar, 10 μm.

Similar articles

Cited by

References

    1. Bement, W.M., H.A. Benink, and G. von Dassow. 2005. A microtubule-dependent zone of active RhoA during cleavage plane specification. J. Cell Biol. 170:91–101. - PMC - PubMed
    1. Benink, H.A., and W.M. Bement. 2005. Concentric zones of active RhoA and Cdc42 around single cell wounds. J. Cell Biol. 168:429–439. - PMC - PubMed
    1. Bokoch, G.M. 2003. Biology of the p21-activated kinases. Annu. Rev. Biochem. 72:743–781. - PubMed
    1. Chung, C.Y., G. Potikyan, and R.A. Firtel. 2001. Control of cell polarity and chemotaxis by Akt/PKB and PI3 kinase through the regulation of PAKa. Mol. Cell. 7:937–947. - PubMed
    1. de Anda, F.C., G. Pollarolo, J.S. Da Silva, P.G. Camoletto, F. Feiguin, and C.G. Dotti. 2005. Centrosome localization determines neuronal polarity. Nature. 436:704–708. - PubMed

Publication types

MeSH terms

Substances