. 2006 Aug 7;203(8):1999-2008.
doi: 10.1084/jem.20060401. Epub 2006 Jul 24.

Properties regulating the nature of the plasmacytoid dendritic cell response to Toll-like receptor 9 activation

Affiliations

Properties regulating the nature of the plasmacytoid dendritic cell response to Toll-like receptor 9 activation

Cristiana Guiducci et al. J Exp Med. .

Abstract

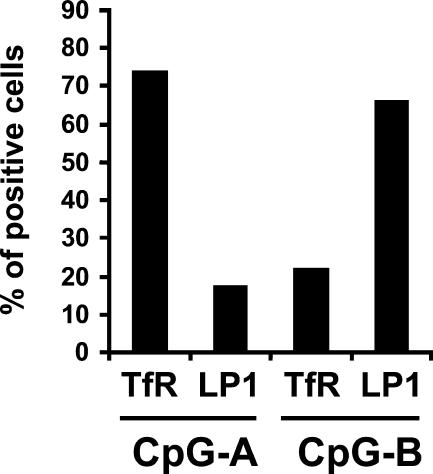
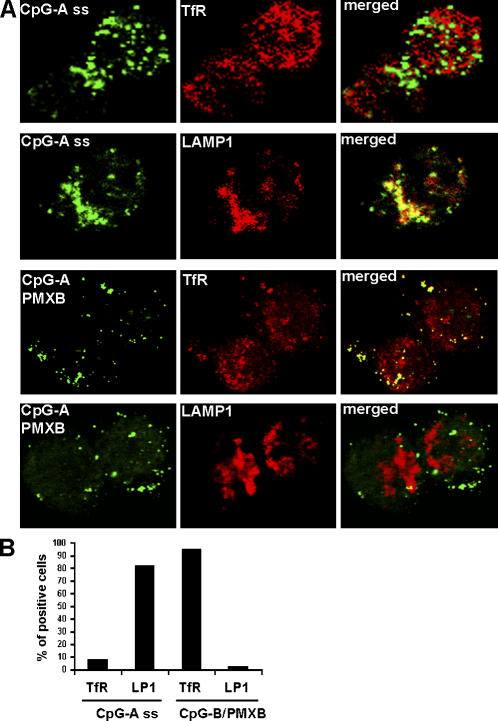
Human plasmacytoid dendritic cells (PDCs) can produce interferon (IFN)-alpha and/or mature and participate in the adaptive immune response. Three classes of CpG oligonucleotide ligands for Toll-like receptor (TLR)9 can be distinguished by different sequence motifs and different abilities to stimulate IFN-alpha production and maturation of PDCs. We show that the nature of the PDC response is determined by the higher order structure and endosomal location of the CpG oligonucleotide. Activation of TLR9 by the multimeric CpG-A occurs in transferrin receptor (TfR)-positive endosomes and leads exclusively to IFN-alpha production, whereas monomeric CpG-B oligonucleotides localize to lysosome-associated membrane protein (LAMP)-1-positive endosomes and promote maturation of PDCs. However, CpG-B, when complexed into microparticles, localizes in TfR-positive endosomes and induces IFN-alpha from PDCs, whereas monomeric forms of CpG-A localize to LAMP-1-positive endosomes accompanied by the loss of IFN-alpha production and a gain in PDC maturation activity. CpG-C sequences, which induce both IFN-alpha and maturation of PDCs, are distributed in both type of endosomes. Encapsulation of CpG-C in liposomes stable above pH 5.75 completely abrogated the IFN-alpha response while increasing PDC maturation. This establishes that the primary determinant of TLR9 signaling is not valency but endosomal location and demonstrates a strict compartmentalization of the biological response to TLR9 activation in PDCs.


Figures

Figure 1.
Figure 1.
Structural complexity of TLR9 ligands correlates with their ability to induce IFN-α production from PDCs. 5 × 10⁴ purified PDCs were cultured with different concentrations of ISS either alone or in combination with PMXB (100 μg/ml) (A, D, E). (B) Representation of microparticles composed of CpG-B and PMXB using electronic microscopy (Hitachi S-5000). Cells were also stimulated with the indicated concentrations of (C) CpG-B either alone or conjugated with ficoll, (D and E) with the single stranded form of CpG-A (CpG-A ss) and (E) using CpG-A where the last six bases were replaced by 7-deaza-guanosines (CpG-A [7dG]). After 16 h, supernatants were harvested and IFN-α production was evaluated using immunoassay. Averages of 14 (A) and 5 (C–E) independent donors are shown. *, P < 0.05.
Figure 2.
Figure 2.
ISS forming highly aggregated structures have decreased capability to induce maturation of human PDCs. Purified PDCs (105 cells) were stimulated with ISS (0.1–2 μM) alone or combined with PMXB. After 16 h, cells were characterized for CD80 and CD86 expression by flow cytometry analysis. A and C show representative dot plots, whereas B and D show cumulative mean fluorescence intensities. One representative (A and C) and averages of four independent donors (B and D) are shown. *, P < 0.05.
Figure 3.
Figure 3.
Differential induction of maturation by the different forms of CpG correlates with their ability to promote T cell activation. Purified PDCs (8 × 10⁴ cells) were stimulated with ISS alone or combined with PMXB for 24 h. Naive CFSE-labeled allogenic CD4+ T cells were added (1:2) and incubated for an additional 4 d. Cells were gated on CD3 and examined for the frequency of dividing cells based on CFSE dilution by flow cytometry. (A) One representative and (B) averages of 16 independent MLR reactions are shown. **, P < 0.01; ***, P < 0.001.
Figure 4.
Figure 4.
CpG-A and CpG-B are distributed in different compartments in PDCs. Purified PDCs were cultured with fluorescent CpG-A (A and C) or CpG-B (E and G). Cells were fixed, stained intracellularly with (A and E) antitransferrin receptor (TfR) or (C and G) anti–LAMP-1 antibodies, and imaged by confocal microscopy. Images were acquired using a ZEISS LSM 510 META confocal microscope. We used CpG-A-Rhodamine green-X and CpG-B-Alexa488. Intensity profiles of the merged channel along three randomly chosen lines (, , and 3 shown on each merged staining) were analyzed using the profile tools of the Zeiss LSM software. Examples are shown for (B) CpG-A and TfR, (D) CpG-A and LAMP-1, (F) CpG-B and TfR, and (H) CpG-B and LAMP1. The green line represents the intensity of the ISS, whereas the red line represents the intensity of the endosomal marker. Overlap of the two profiles indicates spatial correlation for the occurrence of the two fluorescent signals. Representative data of 5–10 individual donors are shown.
Figure 5.
Figure 5.
Differential intracellular localization of ISS in human PDCs. Purified PDCs were cultured with fluorescent ISS for 90 min, then fixed and stained intracellularly with antitransferrin receptor (TfR) or anti–LAMP-1 antibodies and imaged by confocal microscopy as described in Fig. 4. Between 25 and 75 cells from at least five different donors were analyzed for colocalization between the ODN and either transferrin receptor (TfR) or LAMP-1 (LP1).
Figure 6.
Figure 6.
The secondary structure of ISS is regulating their intracellular localization in human PDCs. (A and B) Purified PDCs were cultured with fluorescent ISS for 90 min. Cells were fixed, stained intracellularly with antitransferrin receptor (TfR) or anti-LAMP1 antibodies, and imaged by confocal microscopy. We used CpG-A ss-Rhodamine green-X from the same preparation as CpG-A used in Fig. 4 and CpG-B-Alexa488 premixed with PMXB for 30 min. Images were acquired using a ZEISS LSM 510 META confocal microscope. (B) Between 100 and 200 cells were analyzed from three donors for colocalization between the ODN and either transferrin receptor (TfR) or LAMP-1 (LP1).
Figure 7.
Figure 7.
Encapsulation of CpG-C ISS in two pH-sensitive liposome preparations. The liposomes were prepared from mixtures of CHEMS, DOTAP, and PE as described in Materials and methods and purified through gel filtration on a 9-ml Superose 6 column equilibrated with the 0.125 M NaCl, 0.01 M Hepes, pH 8.4 buffer. (A–C) Representation of absorbance monitored at 310 nm (thick line) and 260 nm (thin line) over time is shown. ODN are detected at 260 nm only while the liposomes can be detected at both 260 and 310 nm. (A) Representation of one liposome preparation mixed with free ODN. (B) Representation of one liposome preparation stable until pH < 5.0. (C) Representation of another liposome preparation stable until pH < 6.0.
Figure 8.
Figure 8.
CpG-C ISS lose their ability to induce IFN-α from human PDCs while retaining the ability to induce maturation when encapsulated into pH 5.75 liposomes. Purified PDCs (5 × 10⁴ cells) were cultured with CpG-C (0.5 μg/ml) alone, empty liposomes, CpG-C mixed with empty liposomes, and with CpG-C encapsulated into two different liposome preparations (pH 4.5 or pH 5.75 sensitive) as described in Fig 7. (A) After 16 h, supernatants were harvested, IFN-α production was evaluated using immunoassay, and (B and C) cells were characterized for CD80 and CD86 expression by flow cytometry. (B) Representative dot plots. (C) Averages of the cumulative mean fluorescence intensity for four independent donors representative of 10 donors are shown. *, P < 0.05.

References

    1. Asselin-Paturel, C., and G. Trinchieri. 2005. Production of type I interferons: plasmacytoid dendritic cells and beyond. J. Exp. Med. 202:461–465. - PMC - PubMed
    1. Liu, Y.J. 2005. IPC: professional type 1 interferon-producing cells and plasmacytoid dendritic cell precursors. Annu. Rev. Immunol. 23:275–306. - PubMed
    1. Svensson, H., B. Cederblad, M. Lindahl, and G. Alm. 1996. Stimulation of natural interferon-α/β-producing cells by Staphylococcus aureus. J. Interferon Cytokine Res. 16:7–16. - PubMed
    1. Cella, M., D. Jarrossay, F. Facchetti, O. Alebardi, H. Nakajima, A. Lanzavecchia, and M. Colonna. 1999. Plasmacytoid monocytes migrate to inflamed lymph nodes and produce large amounts of type I interferon. Nat. Med. 5:919–923. - PubMed
    1. Siegal, F.P., N. Kadowaki, M. Shodell, P.A. Fitzgerald-Bocarsly, K. Shah, S. Ho, S. Antonenko, and Y.J. Liu. 1999. The nature of the principal type 1 interferon-producing cells in human blood. Science. 284:1835–1837. - PubMed

Publication types

MeSH terms