

Quantitative high-throughput screening: a titration-based approach that efficiently identifies biological activities in large chemical libraries
- PMID: 16864780
- PMCID: PMC1518803
- DOI: 10.1073/pnas.0604348103
Quantitative high-throughput screening: a titration-based approach that efficiently identifies biological activities in large chemical libraries
Abstract
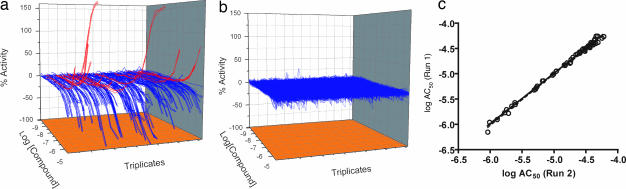
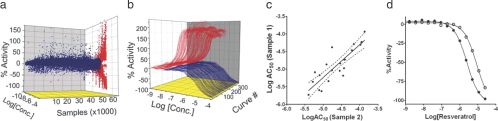
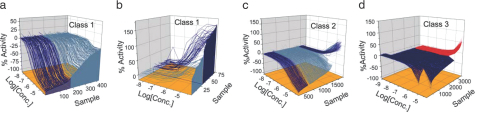
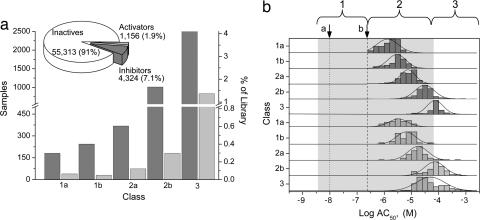
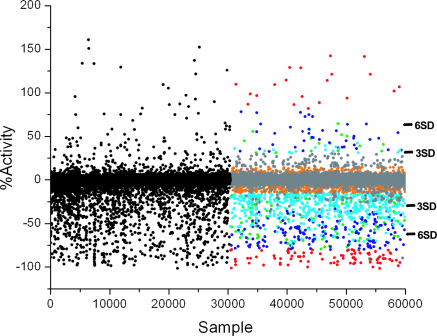
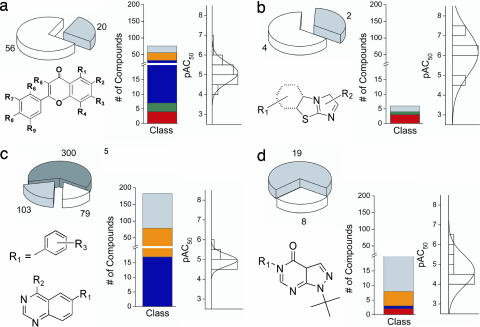
High-throughput screening (HTS) of chemical compounds to identify modulators of molecular targets is a mainstay of pharmaceutical development. Increasingly, HTS is being used to identify chemical probes of gene, pathway, and cell functions, with the ultimate goal of comprehensively delineating relationships between chemical structures and biological activities. Achieving this goal will require methodologies that efficiently generate pharmacological data from the primary screen and reliably profile the range of biological activities associated with large chemical libraries. Traditional HTS, which tests compounds at a single concentration, is not suited to this task, because HTS is burdened by frequent false positives and false negatives and requires extensive follow-up testing. We have developed a paradigm, quantitative HTS (qHTS), tested with the enzyme pyruvate kinase, to generate concentration-response curves for >60,000 compounds in a single experiment. We show that this method is precise, refractory to variations in sample preparation, and identifies compounds with a wide range of activities. Concentration-response curves were classified to rapidly identify pyruvate kinase activators and inhibitors with a variety of potencies and efficacies and elucidate structure-activity relationships directly from the primary screen. Comparison of qHTS with traditional single-concentration HTS revealed a high prevalence of false negatives in the single-point screen. This study demonstrates the feasibility of qHTS for accurately profiling every compound in large chemical libraries (>10(5) compounds). qHTS produces rich data sets that can be immediately mined for reliable biological activities, thereby providing a platform for chemical genomics and accelerating the identification of leads for drug discovery.
Conflict of interest statement
Conflict of interest statement: No conflicts declared.
Figures
Similar articles
-
Application of Titration-Based Screening for the Rapid Pilot Testing of High-Throughput Assays.J Biomol Screen. 2014 Jun;19(5):651-60. doi: 10.1177/1087057113512151. Epub 2013 Nov 18. J Biomol Screen. 2014. PMID: 24246376
-
Drug discovery in the kinase inhibitory field using the Nested Chemical Library technology.Assay Drug Dev Technol. 2005 Oct;3(5):543-51. doi: 10.1089/adt.2005.3.543. Assay Drug Dev Technol. 2005. PMID: 16305311 Review.
-
Enhanced HTS hit selection via a local hit rate analysis.J Chem Inf Model. 2009 Oct;49(10):2202-10. doi: 10.1021/ci900113d. J Chem Inf Model. 2009. PMID: 19795815
-
Learning from the data: mining of large high-throughput screening databases.J Chem Inf Model. 2006 Nov-Dec;46(6):2381-95. doi: 10.1021/ci060102u. J Chem Inf Model. 2006. PMID: 17125181
-
The synergy between combinatorial chemistry and high-throughput screening.Curr Opin Drug Discov Devel. 2008 May;11(3):346-55. Curr Opin Drug Discov Devel. 2008. PMID: 18428088 Review.
Cited by
-
Discovery of NCT-501, a Potent and Selective Theophylline-Based Inhibitor of Aldehyde Dehydrogenase 1A1 (ALDH1A1).J Med Chem. 2015 Aug 13;58(15):5967-78. doi: 10.1021/acs.jmedchem.5b00577. Epub 2015 Jul 24. J Med Chem. 2015. PMID: 26207746 Free PMC article.
-
Diverse small molecule inhibitors of human apurinic/apyrimidinic endonuclease APE1 identified from a screen of a large public collection.PLoS One. 2012;7(10):e47974. doi: 10.1371/journal.pone.0047974. Epub 2012 Oct 23. PLoS One. 2012. PMID: 23110144 Free PMC article.
-
Comparison of Points of Departure for Health Risk Assessment Based on High-Throughput Screening Data.Environ Health Perspect. 2017 Apr;125(4):623-633. doi: 10.1289/EHP408. Epub 2016 Jul 6. Environ Health Perspect. 2017. PMID: 27384688 Free PMC article.
-
Probing the Surface of a Parasite Drug Target Thioredoxin Glutathione Reductase Using Small Molecule Fragments.ACS Infect Dis. 2021 Jul 9;7(7):1932-1944. doi: 10.1021/acsinfecdis.0c00909. Epub 2021 May 5. ACS Infect Dis. 2021. PMID: 33950676 Free PMC article.
-
Identification of small molecule compounds that inhibit the HIF-1 signaling pathway.Mol Cancer. 2009 Dec 9;8:117. doi: 10.1186/1476-4598-8-117. Mol Cancer. 2009. PMID: 20003191 Free PMC article.
References
-
- Hill A. V. J. Physiol. (London) 1910;40:4–7.
-
- Kenakin T. Nat. Rev. Drug Discov. 2003;2:429–438. - PubMed
-
- Hardman J. G., Limbird L. E., Gilman A. G. Goodman & Gilman's The Pharmacological Basis of Therapeutics. New York: McGraw–Hill; 2001.
-
- Schnecke V., Bostrom J. Drug Discov. Today. 2006;11:43–50. - PubMed
-
- Malo N., Hanley J. A., Cerquozzi S., Pelletier J., Nadon R. Nat. Biotechnol. 2006;24:167–175. - PubMed
Publication types
MeSH terms
Substances
Grants and funding
LinkOut - more resources
Full Text Sources
Other Literature Sources
