. 2006 Aug 1;103(31):11549-54.
doi: 10.1073/pnas.0601909103. Epub 2006 Jul 24.

Cellular asymmetry and individuality in directional sensing

Affiliations

Cellular asymmetry and individuality in directional sensing

Azadeh Samadani et al. Proc Natl Acad Sci U S A. .

Abstract

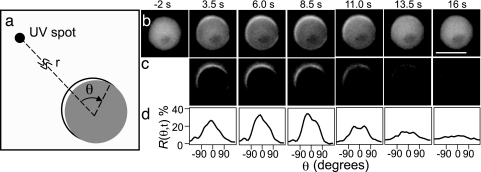
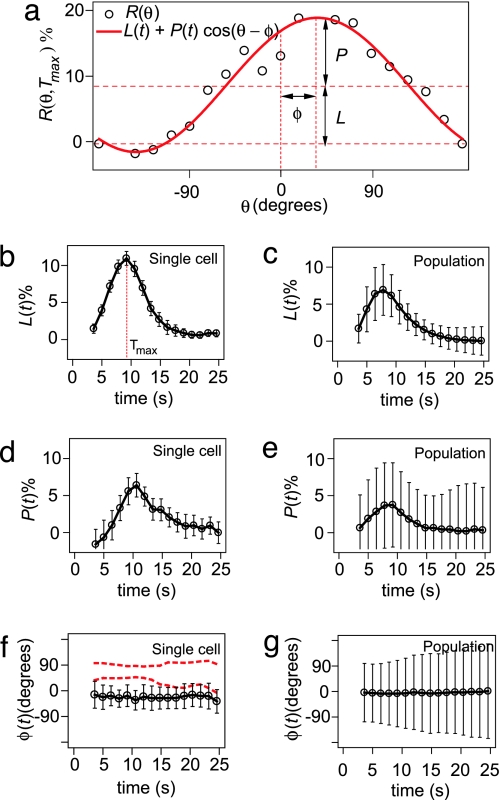
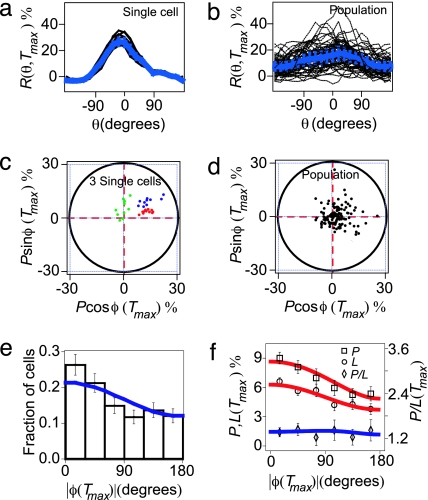
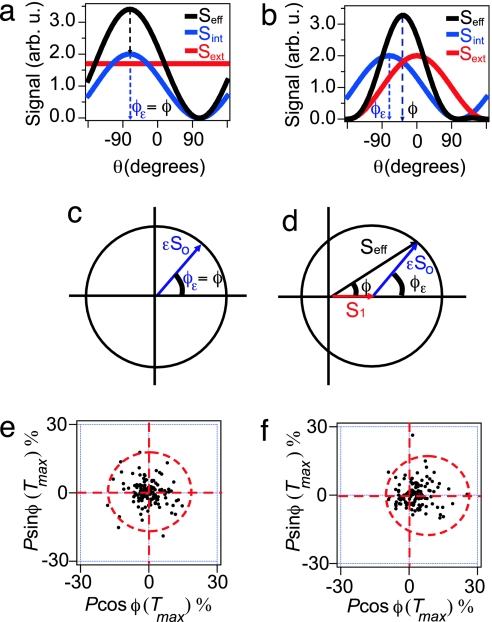
It is generally assumed that single cells in an isogenic population, when exposed to identical environments, exhibit the same behavior. However, it is becoming increasingly clear that, even in a genetically identical population, cellular behavior can vary significantly among cells. Here we explore this variability in the gradient-sensing response of Dictyostelium cells when exposed to repeated spatiotemporal pulses of chemoattractant. Our experiments show the response of a single cell to be highly reproducible from pulse to pulse. In contrast, a large variability in the response direction and magnitude is observed from cell to cell, even when different cells are exposed to the same pulse. First, these results indicate that the gradient-sensing network has inherent asymmetries that can significantly impact the ability of cells to faithfully sense the direction of extracellular signals (cellular asymmetry). Second, we find that the magnitude of this asymmetry varies greatly among cells. Some cells are able to accurately follow the direction of an extracellular stimulus, whereas, in other cells, the intracellular asymmetry dominates, resulting in a polarization axis that is independent of the direction of the extracellular cue (cellular individuality). We integrate these experimental findings into a model that treats the effective signal a cell detects as the product of the extracellular signal and the asymmetric intracellular signal. With this model we successfully predict the population response. This cellular individuality and asymmetry might fundamentally limit the fidelity of signal detection; in contrast, however, it might be beneficial by diversifying phenotypes in isogenic populations.


Conflict of interest statement

Conflict of interest statement: No conflicts declared.

Figures

Fig. 1.
Fig. 1.
Dynamic translocation of CRAC–GFP at the plasma membrane after stimulation with a 2-s pulse of cAMP. (a) The UV uncaging location is positioned a distance r away from the cell center. The angle θ defines the coordinate along the cell’s periphery, where θ = 0 defines the position at the membrane that is closest to the uncaging location. (b) Unprocessed epifluorescence images displaying CRAC–GFP as a function of time. The scale bar denotes 10 μm and r = 70 μm. (c) Subtracted images illustrate the relative change of CRAC–GFP concentration in the membrane with respect to the prestimulus level (t = −2 s). (d) Response function R(θ,t) as a function of time for the images in c.
Fig. 2.
Fig. 2.
Definition of localization, L, polarization, P, and polarization angle, φ, and a comparison between the time dependence of these parameters for a single cell (which is stimulated 10 times) and a population of 40 cells (which are stimulated once). (a) The response function R(θ, Tmax) (open circles) and the fitting function Rfit(θ, Tmax) (red line). (b) Time dependence of L for a single cell. (c) Time dependence of the average L for a population. (d) Time dependence of P for a single cell. (e) Time dependence of the average P for a population. (f) Time dependence of φ for a single cell. The two dashed red lines indicate the dynamics of φ for two other single cells. φ is very reproducible from pulse to pulse, even when φ ≠ 0. (g) Time dependence of the average φ for a population of 40 cells, which averages to zero. Error bars denote standard deviations.
Fig. 3.
Fig. 3.
Comparison between single cell and population response. (a and b) R(θ, Tmax) for a single cell that is stimulated 10 times (a) and a population of 40 cells that are stimulated once (b). (c and d) Polar plot of the polarization at Tmax for three single cells (c) and a population of 100 cells (d). In these representations, one data point represents data from a single cell at Tmax. The distance from a data point to the origin of the polar plot equals the polarization, P(Tmax). The angle between the x axis and the line that connects the data point to the origin of the polar plot is the polarization angle, φ(Tmax). (e) Population probability distribution of |φ(Tmax)|, illustrating the fraction of cells displaying a particular polarization angle at Tmax. (f) Average of L(Tmax) and P(Tmax) (left ordinate) and the ratio of P(Tmax)/L(Tmax) (right ordinate) as a function of |φ(Tmax)|. (e and f) Solid lines are predictions of the geometric model.
Fig. 4.
Fig. 4.
Schematic illustration of the geometric model. (a and b) The effective signal (black line), which is a combination of the intracellular signal (blue line) and the extracellular signal (red line), shown for a uniform cAMP stimulus (a) and for a directed pulse of cAMP (b). (c and d) Graphical representation of the geometric model and the polarization angle, φ, when cells are stimulated with a uniform pulse of cAMP and for a directed pulse of cAMP (d). The effective polarization angle strongly depends on the direction of the intracellular signal, φε. (e and f) Experimentally measured polar plots, as defined in Fig. 3 c and d, for a uniform pulse of cAMP (e) and a directed pulse of cAMP (f).
Fig. 5.
Fig. 5.
Experimentally measured relation between the polarization angle, φ(Tmax), and the extracellular signal, θs, when the direction of the extracellular signal is varied relative to the intracellular signal, φε and comparison to the geometric model. (a) Schematic illustration of the geometric model in the frame of reference of a cell with a fixed φε. (b) The difference image for a cell with a small α (≪1). Red dots on the images indicate the direction of extracellular stimulation. (c) φ(Tmax) versus θs for a cell with small α (≪1). The triangles and circles denote two independent experiments, demonstrating the reproducibility of this assay. (d and e) φ(Tmax) versus θs for a cell with an intermediate α (≈1) (d) and a large α (≫1) (e). The red lines represent fits to the geometric model with fitting parameters α and φε.

References

    1. Rao C. V., Wolf D. M., Arkin A. P. Nature. 2002;420:231–237. - PubMed
    1. Raser J. M., O’Shea E. K. Science. 2005;309:2010–2013. - PMC - PubMed
    1. Kaern M., Elston T. C., Blake W. J., Collins J. J. Nat. Rev. Genet. 2005;6:451–464. - PubMed
    1. Spudich J. L., Koshland D. E., Jr Nature. 1976;262:467–471. - PubMed
    1. Korobkova E., Emonet T., Vilar J. M., Shimizu T. S., Cluzel P. Nature. 2004;428:574–578. - PubMed

Publication types

MeSH terms