Anatomical constraints on source models for high-resolution EEG and MEG derived from MRI
- PMID: 16866569
- PMCID: PMC1995010
Anatomical constraints on source models for high-resolution EEG and MEG derived from MRI
Abstract
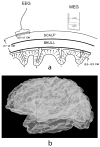
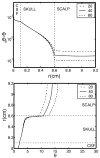
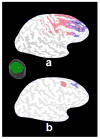
Electroencephalography (EEG) remains the primary tool for measuring changes in dynamic brain function due to disease state with the millisecond temporal resolution of neuronal activity. In recent decades EEG has been supplanted by CT and MRI for the localization of tumors and lesions in the brain. In contrast to the excellent temporal resolution of EEG, the spatial information in EEG is limited by the volume conduction of currents through the tissues of the head. We have extracted source models (position and orientation) from MRI scans to investigate the theoretical relationship between brain sources and EEG recorded on the scalp. Although detailed information about the boundaries between different tissues can also be obtained from MRI, these models are only approximate because of our relatively poor knowledge of the conductivities of the different tissue compartments in living heads. We also compare the resolution of EEG with magnetoecephalography (MEG), which offers the advantage of requiring less detail about volume conduction in the head. The brain's magnetic field depends only on the position of sources in the brain and the position and orientation of the sensors. We demonstrate that EEG and MEG space average neural activity over comparably large volumes of the brain; however, they are preferentially sensitive to sources of different orientation suggesting a complementary role for EEG and MEG. High-resolution EEG methods potentially yield much better localization of source activity in superficial brain areas. These methods do not make any assumptions about the sources, and can be easily co-registered with the brain surface derived from MRI. While there is much information to be gained by using anatomical MRI to develop models of the generators of EEG/MEG, functional neuroimaging (e.g., fMRI) signals and EEG/MEG signals are not easily related.
Figures


Similar articles
-
EEG and MEG coherence: measures of functional connectivity at distinct spatial scales of neocortical dynamics.J Neurosci Methods. 2007 Oct 15;166(1):41-52. doi: 10.1016/j.jneumeth.2007.06.026. Epub 2007 Jul 6. J Neurosci Methods. 2007. PMID: 17698205 Free PMC article.
-
Mapping function in the human brain with magnetoencephalography, anatomical magnetic resonance imaging, and functional magnetic resonance imaging.J Clin Neurophysiol. 1995 Sep;12(5):406-31. doi: 10.1097/00004691-199509010-00002. J Clin Neurophysiol. 1995. PMID: 8576388 Review.
-
Influence of anisotropic electrical conductivity in white matter tissue on the EEG/MEG forward and inverse solution. A high-resolution whole head simulation study.Neuroimage. 2010 May 15;51(1):145-63. doi: 10.1016/j.neuroimage.2010.02.014. Epub 2010 Feb 13. Neuroimage. 2010. PMID: 20156576
-
Estimation of neural dynamics from MEG/EEG cortical current density maps: application to the reconstruction of large-scale cortical synchrony.IEEE Trans Biomed Eng. 2002 Sep;49(9):975-87. doi: 10.1109/TBME.2002.802013. IEEE Trans Biomed Eng. 2002. PMID: 12214887
-
How to use fMRI functional localizers to improve EEG/MEG source estimation.J Neurosci Methods. 2015 Jul 30;250:64-73. doi: 10.1016/j.jneumeth.2014.07.015. Epub 2014 Aug 1. J Neurosci Methods. 2015. PMID: 25088693 Free PMC article. Review.
Cited by
-
Spurious correlations in surface-based functional brain imaging.Imaging Neurosci (Camb). 2025 Feb 18;3:imag_a_00478. doi: 10.1162/imag_a_00478. eCollection 2025. Imaging Neurosci (Camb). 2025. PMID: 40800753 Free PMC article.
-
Screening Tools and Assessment Methods of Cognitive Decline Associated With Age-Related Hearing Loss: A Review.Front Aging Neurosci. 2021 Jul 14;13:677090. doi: 10.3389/fnagi.2021.677090. eCollection 2021. Front Aging Neurosci. 2021. PMID: 34335227 Free PMC article.
-
Assessment of Effective Network Connectivity among MEG None Contaminated Epileptic Transitory Events.Comput Math Methods Med. 2021 Dec 28;2021:6406362. doi: 10.1155/2021/6406362. eCollection 2021. Comput Math Methods Med. 2021. PMID: 34992674 Free PMC article.
-
Recent advances in the effects of microwave radiation on brains.Mil Med Res. 2017 Sep 21;4(1):29. doi: 10.1186/s40779-017-0139-0. Mil Med Res. 2017. PMID: 29502514 Free PMC article. Review.
-
Spurious correlations in surface-based functional brain imaging.bioRxiv [Preprint]. 2024 Jul 14:2024.07.09.602799. doi: 10.1101/2024.07.09.602799. bioRxiv. 2024. Update in: Imaging Neurosci (Camb). 2025 Feb 18;3:imag_a_00478. doi: 10.1162/imag_a_00478. PMID: 39026811 Free PMC article. Updated. Preprint.
References
-
- Walter WG. Traps, tricks and triumphs in EEG: 1936–1966. Electroencephalogr Clin Neurophysiol. 1967;22(4):393. - PubMed
-
- Nagata K, Tagawa K, Hiroi S, Shishido F, Uemera K. Topographic electroencephalographic study of cerebral infarction using computed mapping of EEG. Journal of Cerebral Blood Flow and Metabolism. 1982;2:79–88. - PubMed
-
- Nuwer MR, Jordan SE. Ahn SS Evaluation of stroke using EEG frequency analysis and topographic mapping. Neurology. 1987;37:1153–9. - PubMed
-
- Nunez PL. Toward a quantitative description of large scale neocortical dynamic function and EEG. Behavioral and Brain Sciences. 2000;23:371–398. - PubMed
-
- Nunez PL, Srinivasan R. Electric Fields of the Brain: The Neurophysics of EEG. 2. Oxford UP; New York: 2006.
Publication types
MeSH terms
Grants and funding
LinkOut - more resources
Full Text Sources
Medical
