

Intraspecific DNA content variability in Festuca pallens on different geographical scales and ploidy levels
- PMID: 16868002
- PMCID: PMC2803578
- DOI: 10.1093/aob/mcl150
Intraspecific DNA content variability in Festuca pallens on different geographical scales and ploidy levels
Abstract
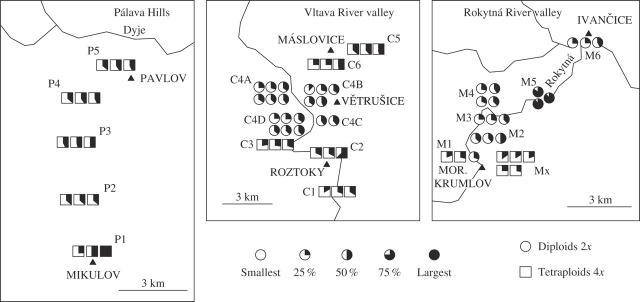
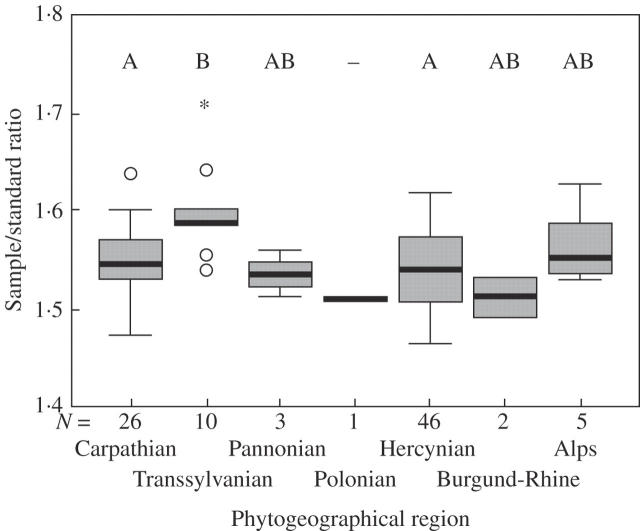
Background and aims: Intraspecific genome size variability of Festuca pallens occurring on relict rocky steppes in Central Europe was studied on two ploidy levels and three geographical scales: (1) local scale of 24 populations, (2) landscape scale of three transects in river canyons or hill systems, and (3) global scale of 160 samples covering the whole distribution area.
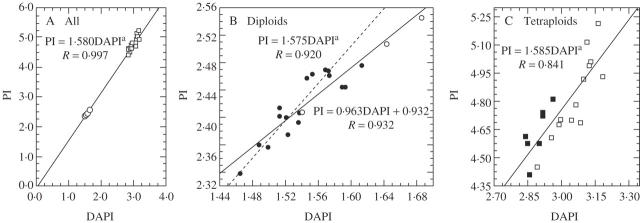
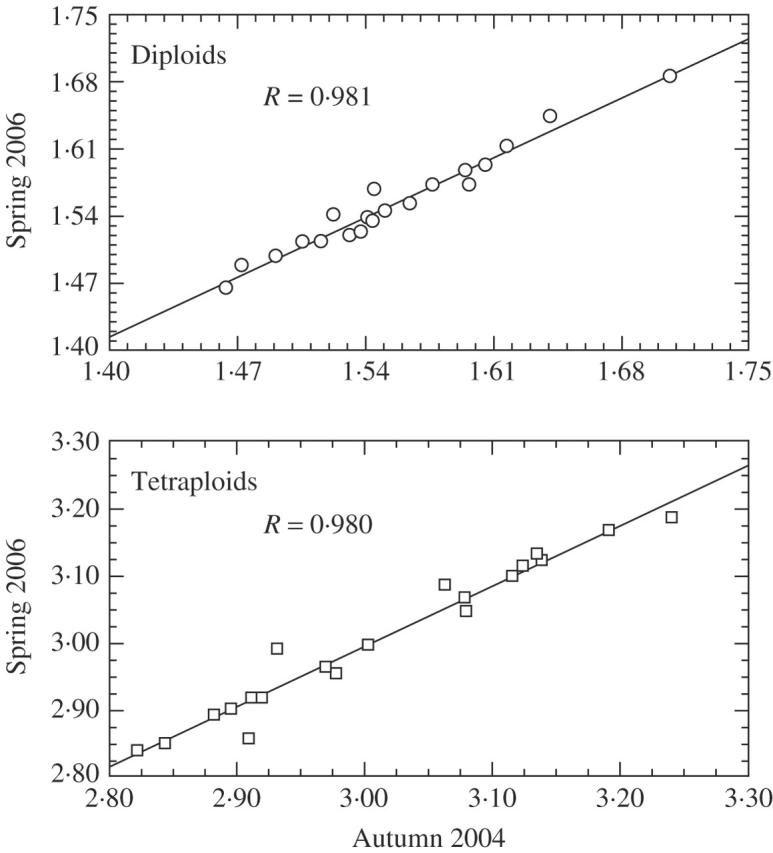
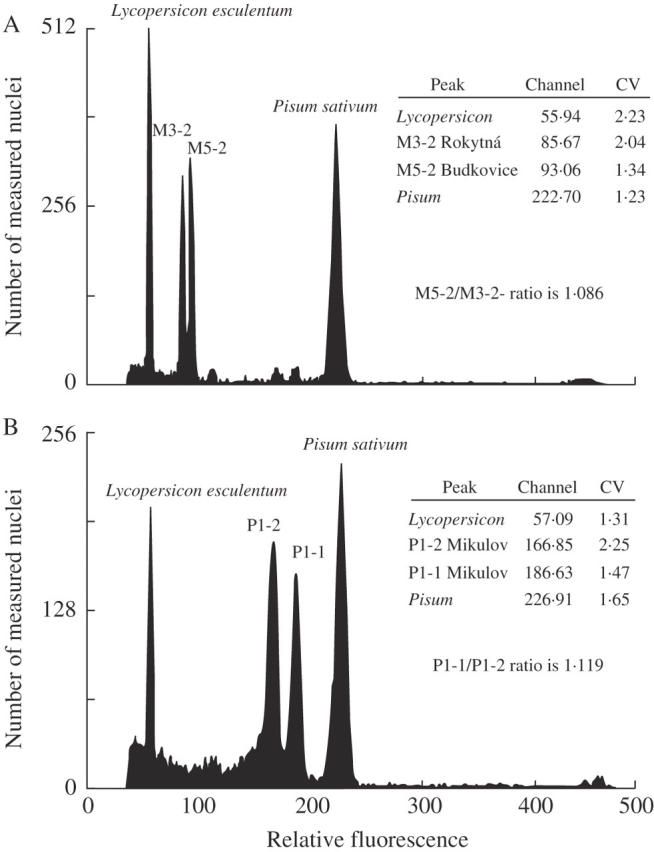
Methods: DAPI flow cytometry of homogeneously cultivated samples (>or=1 year), measured randomly with two internal standards, Lycopersicon esculentum and Pisum sativum. Differences in DNA content were confirmed (1) by the double peaks of simultaneously measured samples, (2) based on measurements carried out in different seasons, and (3) by additional measurements with propidium iodide.
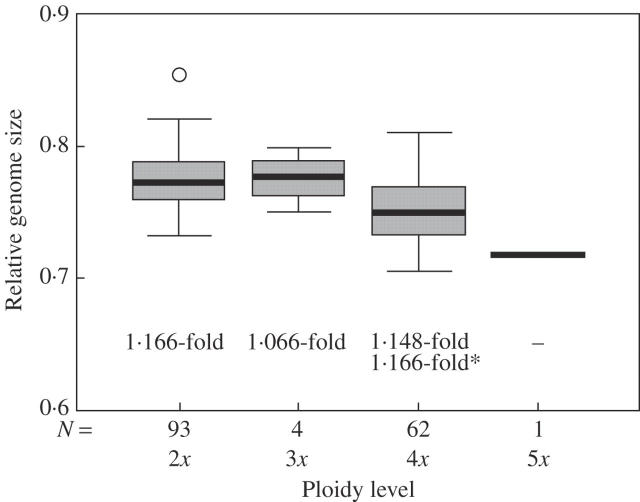
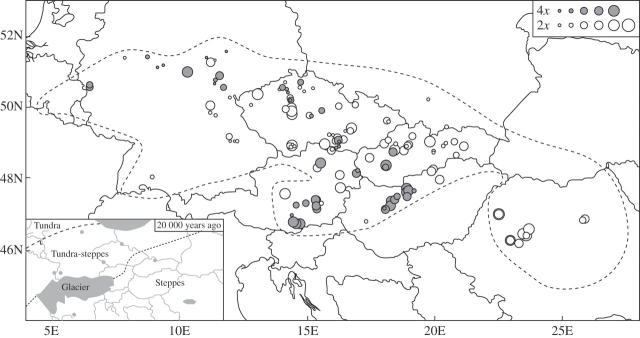
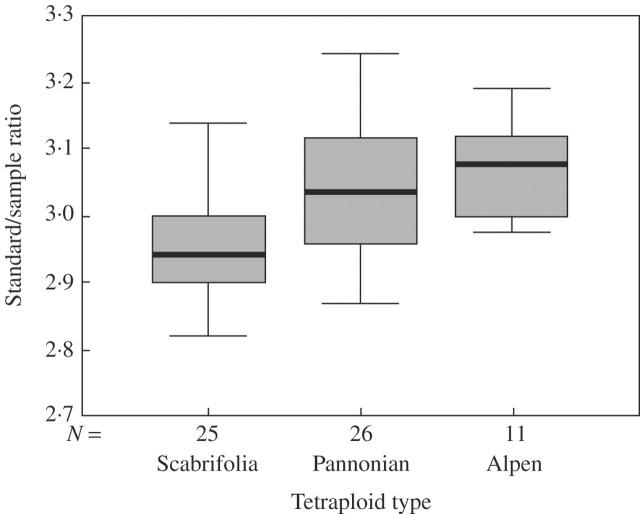
Key results: On a global scale, the relative DNA content ranged between 1.170-fold in diploids and 1.164-fold in tetraploids. A maximum difference of 1.088-fold between the mean relative DNA content of nearby populations was found. In 16 of 24 populations significant variability was shown (P<0.001, 1.121-fold as maximum). For both ploidy levels, the relative genome size had the same range and geographical pattern, correlated with geographical coordinates (P<0.01). Diploids with larger genomes occur on relict habitats (P<0.01), and in areas of periglacial steppes (20,000 years ago; P<0.02). In tetraploids, the relative DNA content differs among the three previously recognized geographical types (Alpine, Pannonian and Scabrifolia, P<0.001). Tetraploids have a relative DNA content smaller than twice that of the diploids (P<0.001). An influence of microhabitat on DNA content variation was not confirmed.
Conclusions: Genome size variability occurs over all spatial scales: intrapopulation, landscape and global. Correlation between geographical coordinates and palaeovegetation type, concomitant with diploids and tetraploids, and no influence of microhabitat were found. Genome size decreases in tetraploids. Lower CVs, and thus higher accuracy, resolution and reproducibility, favour DAPI measurements for the study of intraspecific genome size variability.
Figures
Similar articles
-
Intrapopulation genome size dynamics in Festuca pallens.Ann Bot. 2008 Oct;102(4):599-607. doi: 10.1093/aob/mcn133. Epub 2008 Aug 5. Ann Bot. 2008. PMID: 18684733 Free PMC article.
-
Random distribution pattern and non-adaptivity of genome size in a highly variable population of Festuca pallens.Ann Bot. 2007 Jul;100(1):141-50. doi: 10.1093/aob/mcm095. Epub 2007 Jun 12. Ann Bot. 2007. PMID: 17565968 Free PMC article.
-
Towards resolving the Knautia arvensis agg. (Dipsacaceae) puzzle: primary and secondary contact zones and ploidy segregation at landscape and microgeographic scales.Ann Bot. 2009 Apr;103(6):963-74. doi: 10.1093/aob/mcp016. Epub 2009 Feb 4. Ann Bot. 2009. PMID: 19196717 Free PMC article.
-
Reference standards for flow cytometric estimation of absolute nuclear DNA content in plants.Cytometry A. 2022 Sep;101(9):710-724. doi: 10.1002/cyto.a.24495. Epub 2021 Aug 18. Cytometry A. 2022. PMID: 34405937 Free PMC article. Review.
-
Application-based guidelines for best practices in plant flow cytometry.Cytometry A. 2022 Sep;101(9):749-781. doi: 10.1002/cyto.a.24499. Epub 2021 Sep 29. Cytometry A. 2022. PMID: 34585818 Review.
Cited by
-
Evolutionary and Taxonomic Implications of Variation in Nuclear Genome Size: Lesson from the Grass Genus Anthoxanthum (Poaceae).PLoS One. 2015 Jul 24;10(7):e0133748. doi: 10.1371/journal.pone.0133748. eCollection 2015. PLoS One. 2015. PMID: 26207824 Free PMC article.
-
Intrapopulation genome size dynamics in Festuca pallens.Ann Bot. 2008 Oct;102(4):599-607. doi: 10.1093/aob/mcn133. Epub 2008 Aug 5. Ann Bot. 2008. PMID: 18684733 Free PMC article.
-
Genome size and GC content evolution of Festuca: ancestral expansion and subsequent reduction.Ann Bot. 2008 Feb;101(3):421-33. doi: 10.1093/aob/mcm307. Epub 2007 Dec 24. Ann Bot. 2008. PMID: 18158307 Free PMC article.
-
Cytotype diversity and genome size variation in eastern Asian polyploid Cardamine (Brassicaceae) species.Ann Bot. 2010 Feb;105(2):249-64. doi: 10.1093/aob/mcp282. Epub 2009 Dec 10. Ann Bot. 2010. PMID: 20007978 Free PMC article.
-
Crop-to-wild hybridization in cherries-Empirical evidence from Prunus fruticosa.Evol Appl. 2018 Jul 26;11(9):1748-1759. doi: 10.1111/eva.12677. eCollection 2018 Oct. Evol Appl. 2018. PMID: 30344640 Free PMC article.
References
-
- Auquier P. 1977. Taxonomie et nomenclature de quelques Festuca tétraploides du groupe de Festuca ovina L. s.l. en Europe moyenne. Bulletin du Jardin Botanique National de Belgique 47: 99–116.
-
- Ayonoadu U, Rees H. 1971. The effects of B-chromosomes on the nuclear phenotype in root meristems of maize. Heredity 27: 365–383.
-
- Barow M, Meister A. 2002. Lack of correlation between AT frequency and genome size in higher plants and the effect of nonrandomness of base sequences on dye binding. Cytometry 47: 1–7. - PubMed
-
- Bassi P, Cionini PG, Cremonini R, Seghizzi P. 1984. Under representation of nuclear DNA sequences in differentiating root cells of Vicia faba. Protoplasma 123: 70–77.
-
- Bennett MD. 1976. DNA amount, latitude and crop plant distribution. Environmental and Experimental Botany 16: 93–108.
