Histone acetylation is associated with differential gene expression in the rapid and robust memory CD8(+) T-cell response
- PMID: 16868257
- PMCID: PMC1895425
- DOI: 10.1182/blood-2006-02-005520
Histone acetylation is associated with differential gene expression in the rapid and robust memory CD8(+) T-cell response
Abstract
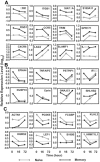
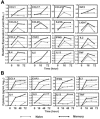
To understand the molecular basis for the rapid and robust memory T-cell responses, we examined gene expression and chromatin modification by histone H3 lysine 9 (H3K9) acetylation in resting and activated human naive and memory CD8(+) T cells. We found that, although overall gene expression patterns were similar, a number of genes are differentially expressed in either memory or naive cells in their resting and activated states. To further elucidate the basis for differential gene expression, we assessed the role of histone H3K9 acetylation in differential gene expression. Strikingly, higher H3K9 acetylation levels were detected in resting memory cells, prior to their activation, for those genes that were differentially expressed following activation, indicating that hyperacetylation of histone H3K9 may play a role in selective and rapid gene expression of memory CD8(+) T cells. Consistent with this model, we showed that inducing high levels of H3K9 acetylation resulted in an increased expression in naive cells of those genes that are normally expressed differentially in memory cells. Together, these findings suggest that differential gene expression mediated at least in part by histone H3K9 hyperacetylation may be responsible for the rapid and robust memory CD8(+) T-cell response.
Figures


Similar articles
-
Histone acetylation facilitates rapid and robust memory CD8 T cell response through differential expression of effector molecules (eomesodermin and its targets: perforin and granzyme B).J Immunol. 2008 Jun 15;180(12):8102-8. doi: 10.4049/jimmunol.180.12.8102. J Immunol. 2008. PMID: 18523274 Free PMC article.
-
Histone acetylation at the single-cell level: a marker of memory CD8+ T cell differentiation and functionality.J Immunol. 2010 May 1;184(9):4631-6. doi: 10.4049/jimmunol.0903830. Epub 2010 Mar 22. J Immunol. 2010. PMID: 20308634
-
Epigenetic remodeling of the IL-2 and IFN-gamma loci in memory CD8 T cells is influenced by CD4 T cells.J Immunol. 2006 Jul 15;177(2):1062-9. doi: 10.4049/jimmunol.177.2.1062. J Immunol. 2006. PMID: 16818762
-
Epigenetic Networks Regulate the Transcriptional Program in Memory and Terminally Differentiated CD8+ T Cells.J Immunol. 2017 Jan 15;198(2):937-949. doi: 10.4049/jimmunol.1601102. Epub 2016 Dec 14. J Immunol. 2017. PMID: 27974453
-
Generating long-lived CD8(+) T-cell memory: Insights from epigenetic programs.Eur J Immunol. 2016 Jul;46(7):1548-62. doi: 10.1002/eji.201545550. Eur J Immunol. 2016. PMID: 27230488 Free PMC article. Review.
Cited by
-
Epigenetic drug discovery: breaking through the immune barrier.Nat Rev Drug Discov. 2016 Dec;15(12):835-853. doi: 10.1038/nrd.2016.185. Epub 2016 Oct 21. Nat Rev Drug Discov. 2016. PMID: 27765940 Review.
-
Transcriptional and Epigenetic Regulation of Effector and Memory CD8 T Cell Differentiation.Front Immunol. 2018 Dec 7;9:2826. doi: 10.3389/fimmu.2018.02826. eCollection 2018. Front Immunol. 2018. PMID: 30581433 Free PMC article. Review.
-
Effect of Dietary Fiber and Metabolites on Mast Cell Activation and Mast Cell-Associated Diseases.Front Immunol. 2018 May 29;9:1067. doi: 10.3389/fimmu.2018.01067. eCollection 2018. Front Immunol. 2018. PMID: 29910798 Free PMC article. Review.
-
Chronic viral infection impairs immune memory to a different pathogen.PLoS Pathog. 2024 Mar 28;20(3):e1012113. doi: 10.1371/journal.ppat.1012113. eCollection 2024 Mar. PLoS Pathog. 2024. PMID: 38547316 Free PMC article.
-
Krüppel-like factor 4 regulates B cell number and activation-induced B cell proliferation.J Immunol. 2007 Oct 1;179(7):4679-84. doi: 10.4049/jimmunol.179.7.4679. J Immunol. 2007. PMID: 17878366 Free PMC article.
References
-
- Dutton RW, Bradley LM, Swain SL. T cell memory. Annu Rev Immunol. 1998;16: 201-223. - PubMed
-
- Kaech SM, Wherry EJ, Ahmed R. Effector and memory T-cell differentiation: implications for vaccine development. Nat Rev Immunol. 2002; 2: 251-262. - PubMed
-
- Van Lier RA, ten Berge IJ, Gamadia LE. Human CD8(+) T-cell differentiation in response to viruses. Nat Rev Immunol. 2003;3: 931-939. - PubMed
-
- Seder RA, Ahmed R. Similarities and differences in CD4+ and CD8+ effector and memory T cell generation. Nat Immunol. 2003;4: 835-842. - PubMed
Publication types
MeSH terms
Substances
Grants and funding
LinkOut - more resources
Full Text Sources
Other Literature Sources
Research Materials

