

Increasing incidence of childhood tumours of the central nervous system in Denmark, 1980-1996
- PMID: 16868540
- PMCID: PMC2360646
- DOI: 10.1038/sj.bjc.6603278
Increasing incidence of childhood tumours of the central nervous system in Denmark, 1980-1996
Abstract
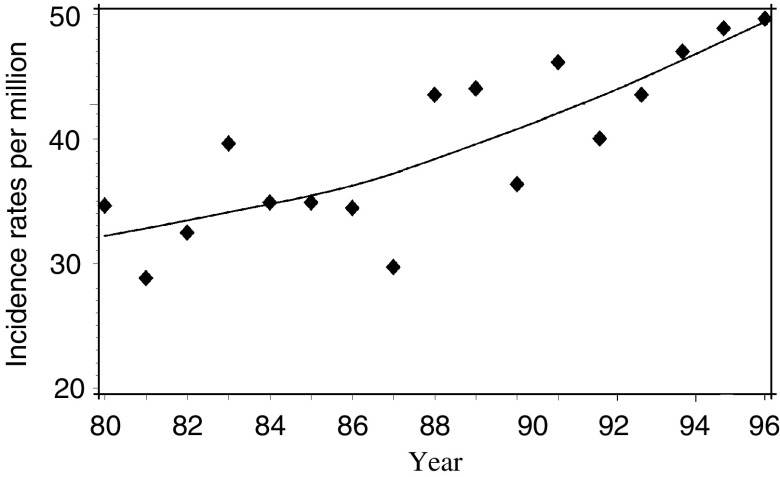
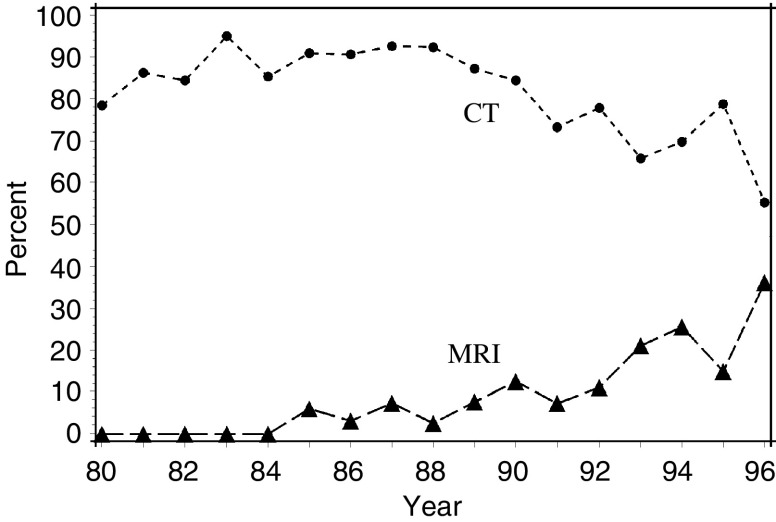
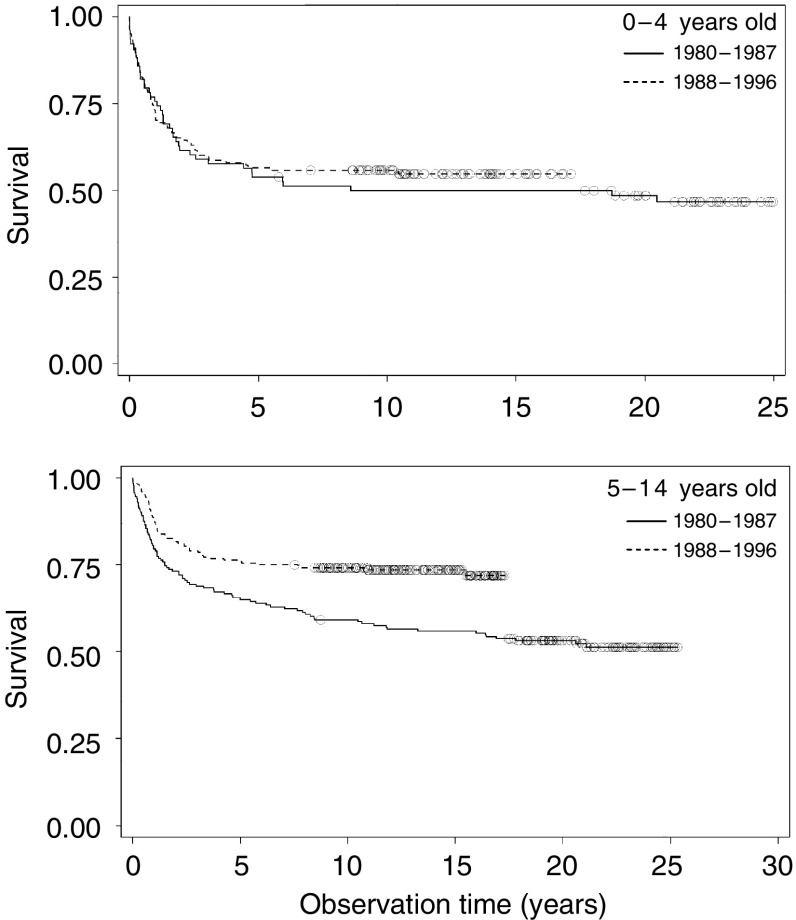
The registered incidence rate of childhood central nervous system (CNS) tumours has increased in several countries. It is uncertain whether these increases are biologically real or owing to improved diagnostic methods. We explored the medical records of 626 CNS tumours diagnosed in Danish children between 1980 and 1996. Population-based registers were used to extract data on mortality and background population. Temporal patterns were analysed by regression techniques. Most tumours were verified by computed tomography (78%) or magnetic resonance imaging (14%). Overall, the incidence rate increased by 2.9% per year (95% confidence interval (CI): 1.3;4.5) and the mortality rate increased by 1.4% per year (95% CI: -0.4;3.3). Among children aged 0-4 years, the survival rate after diagnosis remained almost unchanged, whereas among children aged 5-14 years, the 10-year survival rate improved from 59 to 74%. These data suggest that the incidence rate of CNS tumours among Danish children has truly increased, although alternative explanations cannot be excluded.
Figures
Similar articles
-
Incidence and survival of childhood central nervous system tumors in Denmark, 1997-2019.Cancer Med. 2022 Jan;11(1):245-256. doi: 10.1002/cam4.4429. Epub 2021 Nov 19. Cancer Med. 2022. PMID: 34800006 Free PMC article.
-
Italian cancer figures--Report 2015: The burden of rare cancers in Italy.Epidemiol Prev. 2016 Jan-Feb;40(1 Suppl 2):1-120. doi: 10.19191/EP16.1S2.P001.035. Epidemiol Prev. 2016. PMID: 26951748
-
The epidemiology series of brain-related disorders in Mongolia: nationwide registry-based epidemiological study on CNS tumours in Mongolia, 2015-2019.J Integr Neurosci. 2022 Jan 28;21(1):24. doi: 10.31083/j.jin2101024. J Integr Neurosci. 2022. PMID: 35164460
-
Italian cancer figures, report 2012: Cancer in children and adolescents.Epidemiol Prev. 2013 Jan-Feb;37(1 Suppl 1):1-225. Epidemiol Prev. 2013. PMID: 23585445 English, Italian.
-
Central nervous system tumours in children: epidemiology and risk factors.Bioelectromagnetics. 2005;Suppl 7:S60-8. doi: 10.1002/bem.20149. Bioelectromagnetics. 2005. PMID: 16142778 Review.
Cited by
-
Incidence trends of childhood central nervous system tumors in Finland 1990-2017.BMC Cancer. 2022 Jul 18;22(1):784. doi: 10.1186/s12885-022-09862-0. BMC Cancer. 2022. PMID: 35850678 Free PMC article.
-
Socioeconomic differences in the risk of childhood central nervous system tumors in Denmark: a nationwide register-based case-control study.Cancer Causes Control. 2020 Oct;31(10):915-929. doi: 10.1007/s10552-020-01332-x. Epub 2020 Aug 7. Cancer Causes Control. 2020. PMID: 32767157 Free PMC article.
-
Patterns of exposure to infectious diseases and social contacts in early life and risk of brain tumours in children and adolescents: an International Case-Control Study (CEFALO).Br J Cancer. 2013 Jun 11;108(11):2346-53. doi: 10.1038/bjc.2013.201. Epub 2013 May 7. Br J Cancer. 2013. PMID: 23652309 Free PMC article.
-
Pediatric Intracranial Tumors over a 5-Year Period in a Tertiary Care Center of North Kerala, India: A Retrospective Analysis.Asian J Neurosurg. 2018 Oct-Dec;13(4):1112-1117. doi: 10.4103/ajns.AJNS_251_17. Asian J Neurosurg. 2018. PMID: 30459878 Free PMC article.
-
Pediatric meningiomas: a single-center experience with 15 consecutive cases and review of the literature.Childs Nerv Syst. 2012 Nov;28(11):1887-96. doi: 10.1007/s00381-012-1823-8. Epub 2012 Jun 6. Childs Nerv Syst. 2012. PMID: 22669518 Review.
References
-
- Alston RD, Newton R, Kelsey A, Newbould MJ, Birch JM, Lawson B, McNally RJ (2003) Childhood medulloblastoma in northwest England 1954 to 1997: incidence and survival. Dev Med Child Neurol 45: 308–314 - PubMed
-
- Andersen TF, Madsen M, Jorgensen J, Mellemkjoer L, Olsen JH (1999) The Danish National Hospital Register. A valuable source of data for modern health sciences. Dan Med Bull 46: 263–268 - PubMed
-
- Birch JM, Marsden HB (1987) A classification scheme for childhood cancer. Int J Cancer 40: 620–624 - PubMed
-
- Black WC (1998) Increasing incidence of childhood primary malignant brain tumors – enigma or no-brainer? J Natl Cancer Inst 90: 1249–1251 - PubMed
-
- Blair V, Birch JM (1994) Patterns and temporal trends in the incidence of malignant disease in children: II. Solid tumours of childhood. Eur J Cancer 30A: 1498–1511 - PubMed
Publication types
MeSH terms
LinkOut - more resources
Full Text Sources
