. 2006 Aug 21;95(4):485-95.
doi: 10.1038/sj.bjc.6603273. Epub 2006 Jul 25.

Methotrexate used in combination with aminolaevulinic acid for photodynamic killing of prostate cancer cells

Affiliations

Methotrexate used in combination with aminolaevulinic acid for photodynamic killing of prostate cancer cells

A K Sinha et al. Br J Cancer. .

Abstract

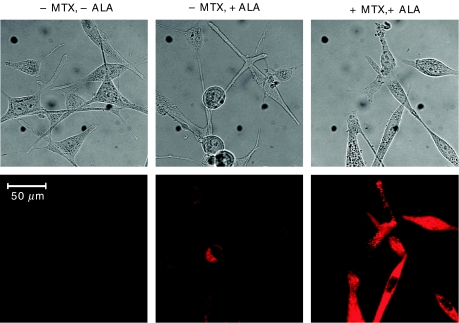
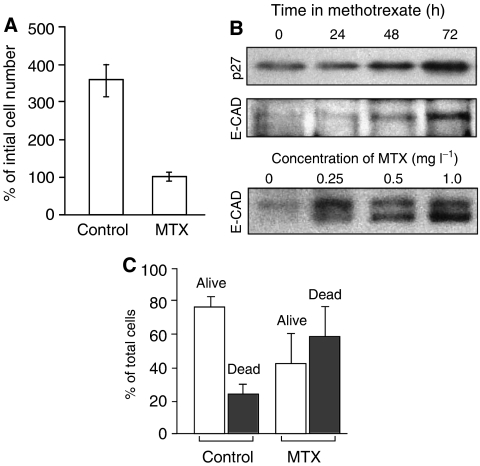
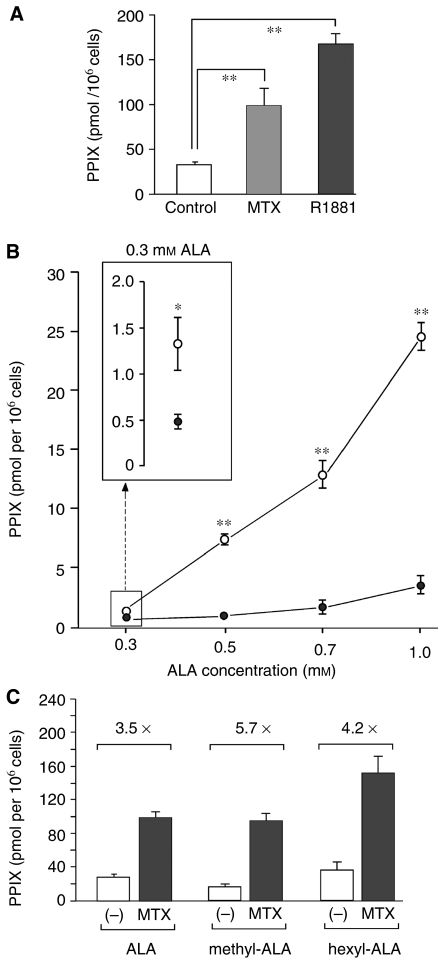
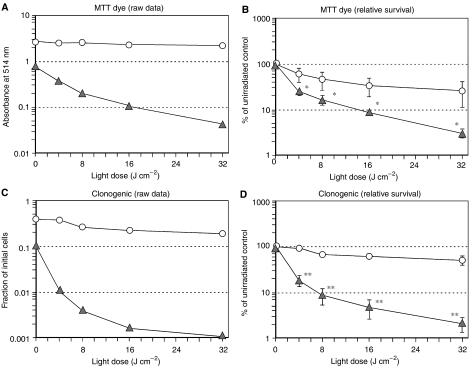
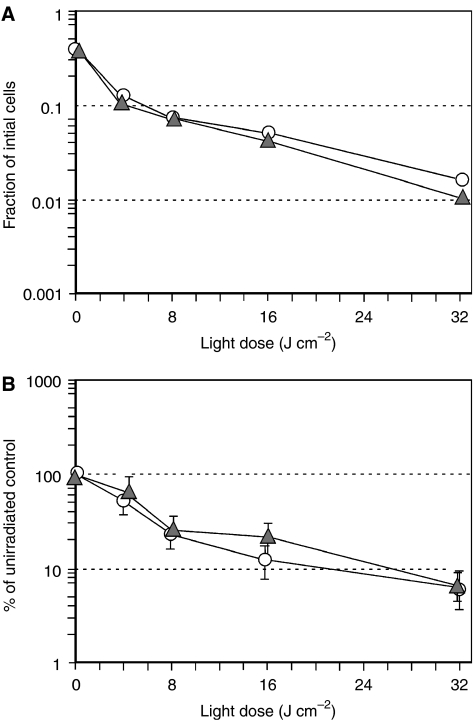
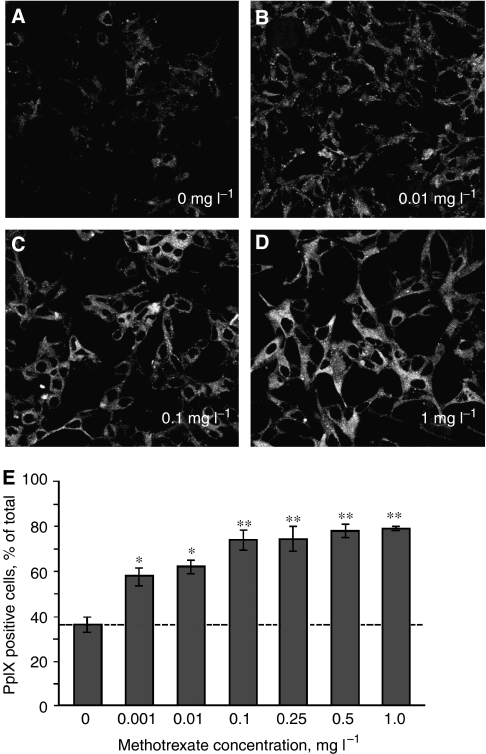
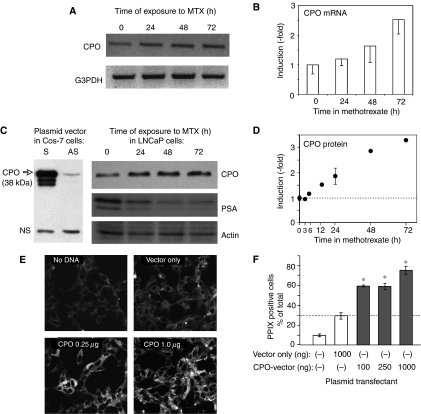
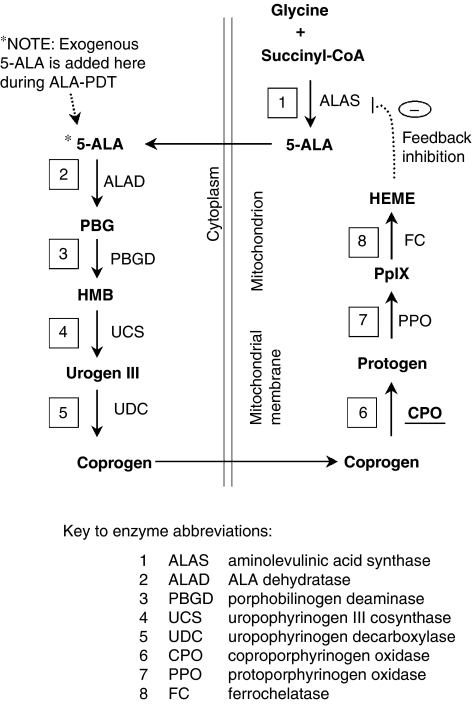
Photodynamic therapy (PDT) using 5-aminolaevulinic acid (ALA) to drive production of an intracellular photosensitiser, protoporphyrin IX (PpIX), is a promising cancer treatment. However, ALA-PDT is still suboptimal for thick or refractory tumours. Searching for new approaches, we tested a known inducer of cellular differentiation, methotrexate (MTX), in combination with ALA-PDT in LNCaP cells. Methotrexate alone promoted growth arrest, differentiation, and apoptosis. Methotrexate pretreatment (1 mg l(-1), 72 h) followed by ALA (0.3 mM, 4 h) resulted in a three-fold increase in intracellular PpIX, by biochemical and confocal analyses. After exposure to 512 nm light, killing was significantly enhanced in MTX-preconditioned cells. The reverse order of treatments, ALA-PDT followed by MTX, yielded no enhancement. Methotrexate caused a similar relative increase in PpIX, whether cells were incubated with ALA, methyl-ALA, or hexyl-ALA, arguing against a major effect upon ALA transport. Searching for an effect among porphyrin synthetic enzymes, we found that coproporphyrinogen oxidase (CPO) was increased three-fold by MTX at the mRNA and protein levels. Transfection of LNCaP cells with a CPO-expressing vector stimulated the accumulation of PpIX. Our data suggest that MTX, when used to modulate intracellular production of endogenous PpIX, may provide a new combination PDT approach for certain cancers.


Figures

Figure 1
Figure 1
Methotrexate pretreatment stimulates the accumulation of PpIX in LNCaP cells. LNCaP cells, seeded in 35 mm dishes 1 day previously, were incubated in culture medium containing MTX (1 mg l−1; +MTX), or in medium without additives (−MTX). After 72 h, ALA was added to some of the dishes (0.3 mM, +ALA; middle and right panels) and the cells were incubated for an additional 4 h. Protoporphyrin IX-specific fluorescence was analysed by fluorescence microscopy (see Materials and Methods). Upper panels: phase-contrast images. Lower panels: PpIX-fluorescent images. Scale bar, 50 μm.
Figure 2
Figure 2
Effect of MTX upon LNCaP growth, differentiation, and apoptosis. (A) Inhibition of cell growth by MTX. LNCaP cells were incubated for 72 h in medium containing 1 mg l−1 MTX, or solvent alone (control). Proliferation is indicated by a 350% net increase in cell number at 72 h vs no increase with MTX. Mean of two experiments carried out in duplicate, ±s.d. (B) Western blots of LNCaP cells incubated in the presence of MTX, and analysed with specific antisera to growth arrest marker (p27/kip-1; upper panel) and a differentiation marker (E-cadherin; lower panels). The upper panels show a time course of induction at a fixed MTX concentration (1 mg l−1); the lower panel shows a dose–response study with a fixed incubation time of 72 h. The E-cadherin doublet at 124 and 135 kDa (lower panel; Bis–Tris gel) was not well resolved on the smaller, Tris-glycine gel (middle panel). (C) Analysis of apoptosis in LNCaP cells after incubation with MTX. Cells were incubated for 72 h in the presence or absence of MTX, as indicated. Adherent and nonadherent cells were pooled and analysed by FACS analysis. The sub-G1 fraction (apoptotic cells, closed bars) and the G1+S+G2/M fractions (living cells, open bars) were expressed as a percentage of total cell number. Bars show mean of six experiments±s.d.
Figure 3
Figure 3
Effect of MTX upon ALA-mediated PpIX accumulation. (A) Pretreatment of LNCaP cells with MTX enhances ALA-induced PpIX accumulation. Cells were cultured in the presence of MTX (1 mg l−1; grey bar) for 72 h, then ALA (0.3 mM) was added for 4 h, and cells harvested for measurements of intracellular PpIX. For a positive control, some dishes were incubated with an androgen, R1881 (0.1 μM; black bar) for 72 h. Protoporphyrin IX concentrations, calculated from a standard curve, were expressed on a per cell basis. Bars are the mean of eight experiments±s.e.m. (*), two-sample t-test, P<0.001. (B) Methotrexate enhances PpIX accumulation in LNCaP cells over a range of ALA concentrations. Cells were pretreated with MTX (open circles) or medium alone (solid circles) for 72 h, then incubated for 4 h in different ALA concentrations before harvest. This experiment shows mean±range of duplicate determinations at each point. Two additional experiments gave qualitatively similar results (not shown). (Inset) Enlargement of the graph at 0.3 mM ALA; note that MTX enhancement of PpIX occurred even at the lowest ALA dose. (Asterisks) Two-sample t-test, comparing MTX to control at the same dose of ALA; (*) P<0.05; (**) P<0.001. (C) Effect of MTX upon accumulation of PpIX derived from different ALA esters. Cells were incubated for 72 h in the absence or presence of MTX, and then for 4 h in the presence of either ALA (0.3 mM), methyl-ALA (0.5 mM), or hexyl-ALA (1 μM) before harvest and PpIX measurement. Bars are the mean±s.e.m. for three experiments, each performed in duplicate. Numbers above each bracket indicate relative increase (-fold) in PpIX owing to MTX. Note the similar -fold increase with all three analogues.
Figure 4
Figure 4
Pretreatment of LNCaP cells with MTX enhances cytotoxicity after the addition of ALA and light. Survival was measured by MTT dye conversion (A and B) or by colony formation (C and D), and presented in two ways. Raw data from a single, typical experiment are shown (A and C), followed by the per cent survival (relative to unirradiated controls), pooled from multiple experiments (B and D). In all cases, cells were preconditioned for 72 h with MTX (1 mg l−1; triangles) or medium alone (circles), then incubated with ALA (0.3 mM) for 4 h and irradiated with light. (A) MTT dye assay at 24 h, single experiment. (B) MTT dye assay, pooled experiments. Mean±s.e.m. of four experiments. (*), P<0.05. (C) Colony formation assay at 13-day, single experiment. (D) Colony formation assay at 13-day, pooled experiments. Mean±s.e.m. of four experiments. (**), P<0.0005. See Materials and Methods and Results for further details.
Figure 5
Figure 5
Photodynamic therapy is not enhanced if MTX is administered after ALA and light. Cells were first subjected to ALA-PDT treatment (4 h of ALA 0.3 mM, followed by exposure to graduated light doses) and plated for colony formation assay. Subsequently, one set of plates was exposed to MTX for 72 h, the other to medium only. Colonies were counted at 13 days. (A) Colony formation assay, single experiment. (B) Colony formation assay, pooled experiments. Mean of four experiments±s.e.m.
Figure 6
Figure 6
Very low concentrations of MTX can enhance PpIX in LNCaP cells. At time zero, LNCaP cells (3 × 10⁵ cells dish−1) were plated on glass cover slips as described in Materials and Methods, and at 24 h, switched to medium containing variable quantities of MTX (0.001–1.0 mg l−1). At 72 h, new medium with 1 mM ALA was added and cells were incubated for 4 h before visualisation of PpIX-specific fluorescence by confocal microscopy. (AD) Representative images (shown here in grey scale) of PpIX-specific fluorescence in LNCaP cells at the MTX concentrations indicated. (E) Semiquantitative analysis of the relative number of cells that were PpIX-positive (% of total cells), performed as described in Materials and Methods. Bars are the mean±s.d. of three digital images per transfection. (*) P<0.001; (**) P<0.0005. The experiment was performed twice with similar results.
Figure 7
Figure 7
Demonstration that MTX treatment leads to increased levels of CPO. (A) Methotrexate treatment of LNCaP cells causes accumulation of CPO mRNA. Cells were exposed for various times to MTX (1 mg l−1), or remained untreated (0 h). Cells were lysed, cDNA prepared, and RT–PCR performed using a CPO gene-specific primer set, as described in Materials and Methods. The resulting PCR product was confirmed by DNA sequencing and by size-similarity to a known plasmid cDNA (not shown). The ethidium-stained, CPO-specific bands are shown here inverted (dark bands). G3PDH, invariant control. (B) Semiquantitative analysis of CPO mRNA. Agarose gels were digitally photographed, and the integrated density of each band measured using NIH Image software. Induction (relative to untreated controls) was calculated after background subtraction and normalisation to the G3PDH bands. Mean±range of two experiments. (C, left side) The anti-CPO epitope antibody recognises full-length CPO protein. Lysates from cos-7 cells were transfected with a plasmid vector (pCPO) expressing CPO inserted in either the sense (S) or antisense (AS) orientation, and analysed by Western blot using the antiserum to CPO. Arrow: CPO-specific signal; NS, nonspecific. (C, right side) CPO is expressed in LNCaP cells and increases with MTX treatment. Equal amounts of protein from lysed cells were separated on acrylamide gels, and immunoblotted with antibodies to CPO, prostate-specific antigen, or actin. The 38 kDa CPO protein is indicated. (D) Semiquantitative analysis of CPO protein. Western blots from experiments examining long and short times of exposure to MTX were scanned densitometrically, and the data combined. Error bars: range of duplicate experiments. (E) Fluorescence images, captured from LNCaP cells that were either not transfected (No DNA), transfected with an empty pcDNA3.1 vector (Vector only), or transfected with different amounts of a plasmid vector overexpressing CPO, followed by incubation with ALA and analysis of the PpIX-specific signal by confocal microscopy. The PpIX-specific signal is shown in grey scale. (F) Semiquantitative analysis of relative PpIX-positive cells (% of total cells) was performed as described in Materials and Methods. Bars represent the mean±s.d. of three images from each of two dishes; Asterisks, P<0.0005 relative to the vector-only control.
Figure 8
Figure 8
Schematic of porphyrin-synthetic pathway to illustrate potential control points for increased PpIX accumulation. Enzymes, with names abbreviated and relative locations in the pathway shown in boxes, are numbered beginning with the initial condensation of glycine and succinyl-CoA. Substrates/products are shown in bold font. The intracellular location of enzymes, relative to the mitochondria and the cytoplasm, is indicated. See Bickers et al (1999) for a fully detailed version.

Similar articles

Cited by

References

    1. Berkowitz RS, Goldstein DP, Bernstein MR (1986) Ten year's experience with methotrexate and folinic acid as primary therapy for gestational trophoblastic disease. Gynecol Oncol 23: 111–118 - PubMed
    1. Bickers DR, Pathak MA, Lim HW (1999) The Porphyrias. In Dermatology in General Medicine Freedberg IMEA (ed) Vol. 2, pp 1766–1803. New York: McGraw-Hill
    1. Bodner AJ, Ting RC, Gallo RC (1981) Induction of differentiation of human promyelocytic leukemia cells (HL-60) by nucleosides and methotrexate. J Natl Cancer Inst 67: 1025–1030 - PubMed
    1. Burres NS, Cass CE (1987) Inhibition of methotrexate-induced differentiation of cultured human choriocarcinoma (BeWo) cells by thymidine. Cancer Res 47: 5059–5064 - PubMed
    1. Campbell MJ, Elstner E, Holden S, Uskokovic M, Koeffler HP (1997) Inhibition of proliferation of prostate cancer cells by a 19-nor-hexafluoride vitamin D3 analogue involves the induction of p21waf1, p27kip1 and E-cadherin. J Mol Endocrinol 19: 15–27 - PubMed

Publication types