

doi: 10.1186/gb-2006-7-7-R66.
Analysis of cell-based RNAi screens
Affiliations
- PMID: 16869968
- PMCID: PMC1779553
- DOI: 10.1186/gb-2006-7-7-R66
Item in Clipboard
Analysis of cell-based RNAi screens
Genome Biol.
2006.
Abstract
RNA interference (RNAi) screening is a powerful technology for functional characterization of biological pathways. Interpretation of RNAi screens requires computational and statistical analysis techniques. We describe a method that integrates all steps to generate a scored phenotype list from raw data. It is implemented in an open-source Bioconductor/R package, cellHTS (http://www.dkfz.de/signaling/cellHTS). The method is useful for the analysis and documentation of individual RNAi screens. Moreover, it is a prerequisite for the integration of multiple experiments.
Figures
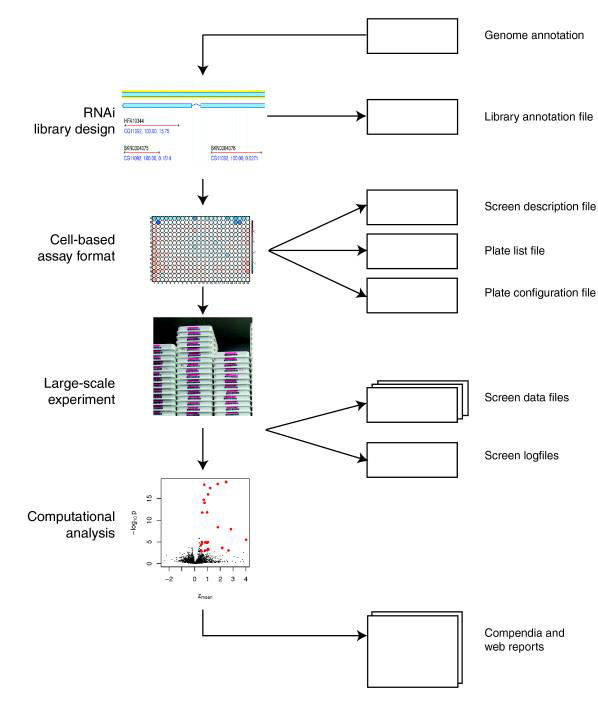
Experimental steps in a cell-based HTS assay. A cell-based HTS assay consists of a set of experimental steps, shown in the left part of the figure, which are recorded in a set of corresponding data structures, shown in the right part of the figure. HTS, high-throughput screening.
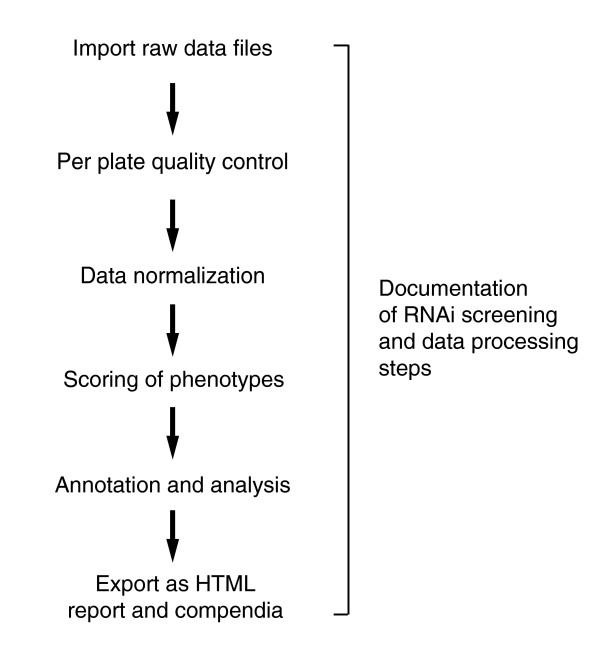
Analysis steps for a cell-based HTS assay. The main steps in the computational analysis of a cell-based HTS assay. HTS, high-throughput screening.
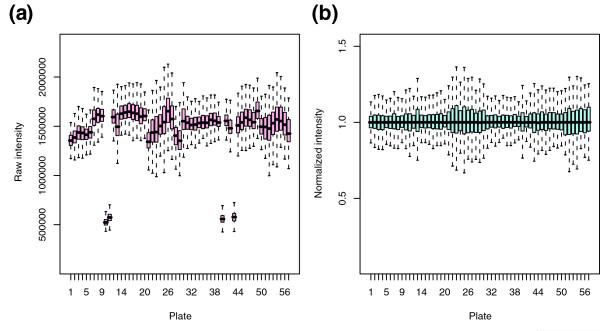
Plate normalization. Box plots of signal intensities in the first replicate set of the example data, grouped by plate. (a) Raw data and (b) after normalization.
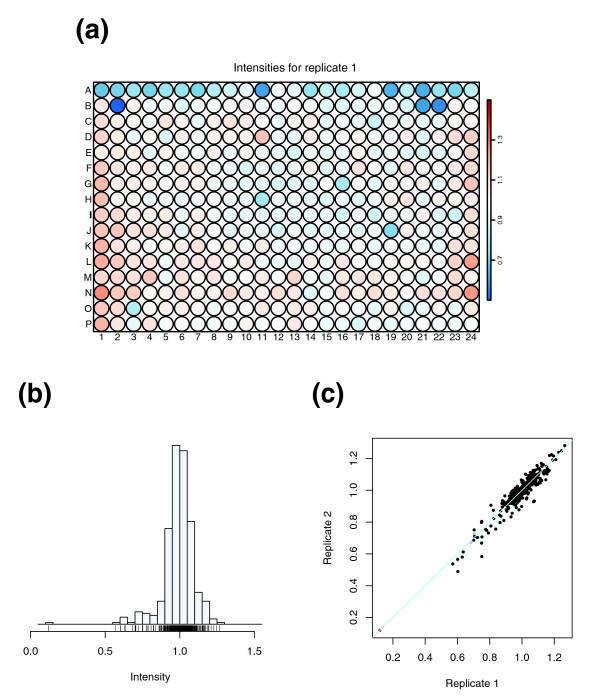
Plate-wise quality plots. (a) Plate plot of signal intensities. A false color scale is used to represent the normalized signal. This visualization helps in quickly detecting gross artifacts that manifest themselves in spatial patterns. In the data shown here the values in the top row were consistently low, which could be traced back to a pipetting problem. (b) Histogram of the signal intensities. (c) Scatterplot between two replicate plate results. Ideally, all points lie on the identity line (x = y).
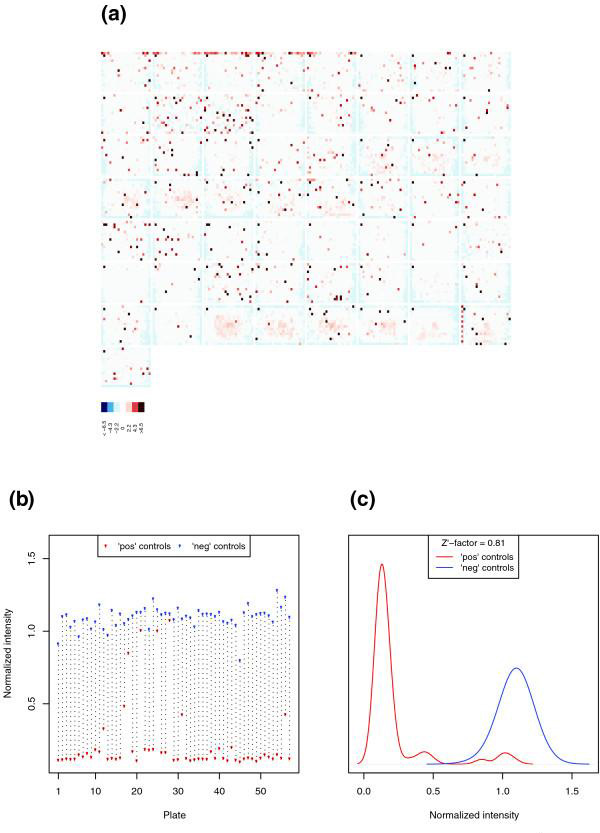
Experiment-wide quality plots. (a) Overview of the complete set of z-score values from a genome-wide screen of 21,306 dsRNAs. The dsRNAs were contained in 57 plates, laid out in eight rows and eight columns, and the 384 z-score values within each plate are plotted in a false color representation whose scale is shown at the bottom of the plot. (b) Signal from positive (red dots) and negative (blue dots) controls (y axis) plotted against the plate number (x axis). (c) Distribution of the signal from positive (red line) and negative (blue line) controls, obtained from kernel density estimates. The distance between the two distributions is quantified by the Z' factor. ds, double-stranded.
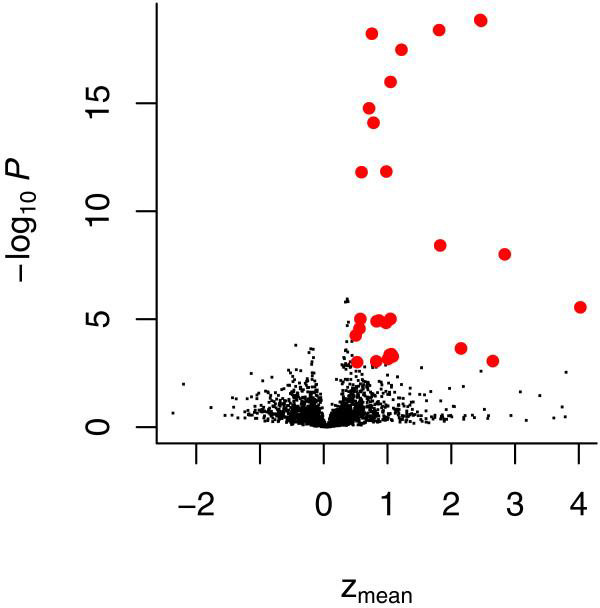
Volcano plot to identify enriched GO categories. Volcano plot of the category analysis. It shows the negative decadic logarithm of the P value versus the mean z-score for each tested GO category. Categories that are strongly enriched for high-scoring hits are marked in red; details on some of these are shown in Table 6. GO, Gene Ontology.
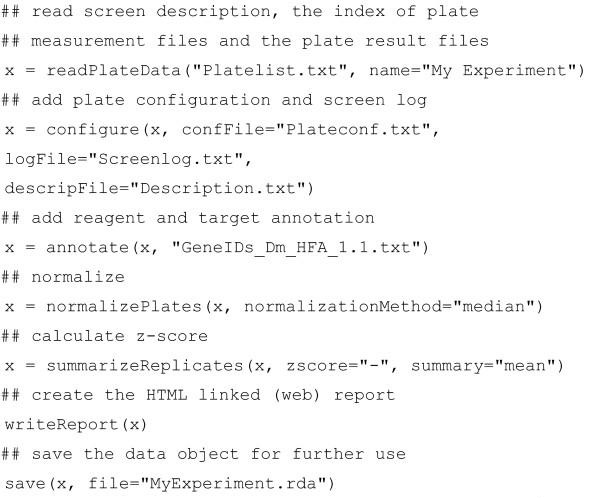
Example cellHTS session.
References
Publication types
MeSH terms
LinkOut - more resources
Full Text Sources
Other Literature Sources
