. 2006 Oct;17(10):4330-42.
doi: 10.1091/mbc.e06-02-0151. Epub 2006 Jul 26.

Tyrosine phosphatases epsilon and alpha perform specific and overlapping functions in regulation of voltage-gated potassium channels in Schwann cells

Affiliations

Tyrosine phosphatases epsilon and alpha perform specific and overlapping functions in regulation of voltage-gated potassium channels in Schwann cells

Zohar Tiran et al. Mol Biol Cell. 2006 Oct.

Abstract

Tyrosine phosphatases (PTPs) epsilon and alpha are closely related and share several molecular functions, such as regulation of Src family kinases and voltage-gated potassium (Kv) channels. Functional interrelationships between PTPepsilon and PTPalpha and the mechanisms by which they regulate K+ channels and Src were analyzed in vivo in mice lacking either or both PTPs. Lack of either PTP increases Kv channel activity and phosphorylation in Schwann cells, indicating these PTPs inhibit Kv current amplitude in vivo. Open probability and unitary conductance of Kv channels are unchanged, suggesting an effect on channel number or organization. PTPalpha inhibits Kv channels more strongly than PTPepsilon; this correlates with constitutive association of PTPalpha with Kv2.1, driven by membranal localization of PTPalpha. PTPalpha, but not PTPepsilon, activates Src in sciatic nerve extracts, suggesting Src deregulation is not responsible exclusively for the observed phenotypes and highlighting an unexpected difference between both PTPs. Developmentally, sciatic nerve myelination is reduced transiently in mice lacking either PTP and more so in mice lacking both PTPs, suggesting both PTPs support myelination but are not fully redundant. We conclude that PTPepsilon and PTPalpha differ significantly in their regulation of Kv channels and Src in the system examined and that similarity between PTPs does not necessarily result in full functional redundancy in vivo.


Figures
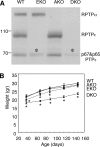
Figure 1.
Figure 1.
PTP expression and body weight of mice used in this study. (A) Expression of RPTPε and RPTPα in brain lysates. Blots containing crude extracts of brain from adult WT, AKO, EKO, and DKO mice were reacted with anti-PTPε antibodies, which also cross-react with RPTPα, to assess expression of PTPε and PTPα in this tissue. Asterisks mark nonspecific bands; molecular mass standards are in kilodaltons. (B) Weights of mice of the indicated genotypes are shown between 40 and 150 d of age. The weight of DKO mice was significantly (15–25%) lower than that of WT, AKO, or EKO mice (Mann–Whitney U-test, p < 0.0001). EKO males weighed slightly less than WT males up to 90 d (Mann–Whitney U-test, p < 0.01). Each data point represents the average weight ± SEM with n = 20–51. Asterisks mark data points significantly different from WT. Similar results were obtained with female mice (our unpublished data).
Figure 2.
Figure 2.
Reduced myelination of axons in sciatic nerves of 5-d-old AKO, EKO, and DKO mice. (A) Distribution of thicknesses of myelin sheaths in wild-type, AKO, EKO, and DKO sciatic nerves (WT, A, E, and D, respectively). n = 1370–2320 individual axons per genotype, as indicated below. (B) Bar diagram comparing the average sheath thickness (in nanometers, ± SEM). WT, 284.2 ± 3.0, n = 2320 sheaths; EKO, 232.6 ± 3.3, n = 1652; AKO, 251.7 ± 3.8, n = 1370; and DKO, 214.9 ± 5.4, n = 1601. All knockout means are distinct from WT mean (p < 0.0001); EKO and AKO means are distinct from DKO mean (EKO, *p = 0.0054); AKO, **p < 0.0001). Statistical significance was determined by Welch's t test. (C) Representative electron microscope pictures of transverse cross-sections through sciatic nerves of 5 d-old WT, AKO, EKO, and DKO mice. Arrows mark several cross-sections of myelinated axons, evident as closed dark figures. Arrowheads mark several unmyelinated axons.
Figure 3.
Figure 3.
Increased Kv channel currents in primary Schwann cells of EKO, AKO, or DKO mice. (A) Blots containing crude extracts from Schwann cells from 3- to 5-d-old WT, AKO, EKO, and DKO mice were reacted with anti-PTPε antibodies to assess expression of cyt-PTPε and PTPα. Asterisks mark nonspecific bands; molecular mass markers are in kilodaltons. (B) The K+ current density (picoamperes/picofarads; mean ± SEM) of WT (n = 12), AKO (n = 11), EKO (n = 14), and DKO (n = 9) Schwann cells plotted against voltage steps (millivolts). At +60 mV, EKO cells exhibit a 47% increase in current density compared with WT cells; analogous values for AKO and DKO cells are +150 and +62%, respectively. (C) Whole-cell K+ currents recorded from primary Schwann cells of the four genotypes. Cells were stepped from a holding potential of −80 to +60 mV in + 10-mV increments for a 400-ms pulse duration.
Figure 4.
Figure 4.
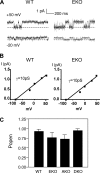
Single-channel properties of Schwann cell K+ currents measured in cell-attached patches. (A) Single channel current traces of WT and EKO Schwann cells are displayed at two different potentials evoked from the cell resting potential (−50 mV). The closed channel state is indicated by the dashed lines. The K+ concentration in the pipette and the bath was 2.5 mM. (B) Representative unitary current–voltage relations measured from WT and EKO Schwann cells (of 21 similar cells). The straight lines correspond to the fit of data points and indicate unitary conductance of 10 pS. (C) Open probability (mean ± SEM) determined from the analysis of 17–21 cells of each the four genotypes. Differences between the four genotypes are not statistically significant.
Figure 5.
Figure 5.
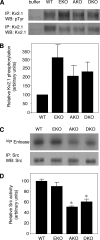
Phosphorylation of Kv2.1 and Src activity in sciatic nerves of WT, EKO, AKO, and DKO mice. (A) Crude membrane fractions of sciatic nerves from 3-d-old WT, EKO, AKO, and DKO mice were prepared and solubilized. After immunoprecipitation with anti-Kv2.1 antibodies, precipitates were blotted with anti-pTyr antibodies (top) followed by stripping and blotting with anti-Kv2.1 antibodies (bottom). Blots are from a representative experiment of four performed. (B) Bar diagram showing Kv2.1 phosphorylation intensity (± SEM) normalized to Kv2.1 protein content and presented relative to WT (= 100): EKO = 320.4 ± 105.8, AKO = 216.0 ± 58.3, and DKO = 231.8 ± 57.4; n = 4 repeats. (C) Src protein was immunoprecipitated from sciatic nerve extracts of 3- to 4-d-old mice and allowed to catalyze incorporation of 32P into enolase. Reaction mixture was subject to SDS-PAGE and blotting. Blot was exposed to document enolase-associated radioactivity (top) and then probed with anti-Src antibody to document amount of Src protein present in the precipitate (bottom). (D) Bar diagram showing relative Src activity (± SEM) in the four genotypes studied: WT = 1.00 ± 0.04; EKO = 0.89 ± 0.09; AKO = 0.50 ± 0.02; and DKO = 0.61 ± 0.05. n = 3–5 experiments per genotype. AKO and DKO are statistically different (asterisks) by Student's t test from WT (p ≤ 0.0006) and EKO (p ≤ 0.018). WT versus EKO and AKO versus DKO are not statistically distinct.
Figure 6.
Figure 6.
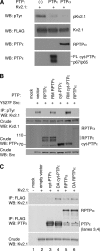
PTPε and PTPα regulate tyrosine phosphorylation of Kv2.1. (A) RPTPα and cyt-PTPε can dephosphorylate tyrosine-phosphorylated Kv2.1 in vitro. Top, phosphorylated Kv2.1 remaining after incubation without added PTP or after addition of purified cyt-PTPε or RPTPα as indicated. Remaining panels document addition of purified pKv2.1, cyt-PTPε, and RPTPα to the various reactions. FL, full-length cyt-PTPε. Anti-PTPε antibodies cross-react with RPTPα. (B) RPTPα and cyt-PTPε reduce Src-mediated phosphorylation of Kv2.1 in cells. HEK293 cells stably expressing Kv2.1 were transiently transfected with activated (Y527F) Src, together with RPTPε, cyt-PTPε, RPTPα, or the inactive mutants R340M RPTPε and R283M cyt-PTPε. Cells were lysed and immunoprecipitated with anti-phosphotyrosine antibodies followed by blotting with anti-Kv2.1 antibodies. Blots containing crude extracts were reacted with anti-Kv2.1, anti-PTPε, and anti-Src antibodies to assess expression of these proteins. Blots are from a representative experiment of three performed. (C) Constitutive association of Kv2.1 with RPTPα. HEK293 cells were transiently transfected with Kv2.1 together with FLAG-tagged cyt-PTPε, RPTPα, or their substrate-trapping mutants (D245A cyt-PTPε and D437A RPTPα), as indicated. Following cell lysis and anti-FLAG immunoprecipitation, coprecipitating Kv2.1 was detected by blotting with anti-Kv2.1 antibodies (top). Second and third panels depict amounts of precipitating PTPs and expression of Kv2.1 in the crude lysates, respectively. Asterisks denote p66 PTPα, a cytosolic cleaved form of RPTPα (Gil-Henn et al., 2001).
Figure 7.
Figure 7.
Membranal localization of PTPs α and ε drives their constitutive interaction with Kv2.1. (A) Schematic representation of the various FLAG-tagged substrate-trapping D-to-A mutants of PTPε and PTPα used in this study: D437A RPTPα, D437A cyt-PTPα, D245A cyt-PTPε, D245A Lck-cyt-PTPε, and D302A RPTPε. The mutated aspartic residue (asterisk) is the same in all cases, although its exact numbering differs among the various molecules. Residue numbering in cyt-PTPα and Lck-cyt-PTPε are as in RPTPα and cyt-PTPε, respectively, for clarity. (B) The subcellular localization of molecules shown in A. After transfection into HEK293 cells, cells were fractionated and the cytoplasmic (C) and membranal (M) fractions were analyzed on 7% SDS-PAGE gels and blotted with anti-PTPε/α antibodies. (C) Constitutive association with Kv2.1 is dependent on membrane localization. HEK293 cells were transiently transfected with WT Kv2.1 (Y) or Y124F Kv2.1 (F) together with the indicated FLAG-tagged substrate-trapping D-to-A mutants. After cell lysis and anti-FLAG immunoprecipitation, amount of coprecipitating Kv2.1 was assessed by blotting. Shown is a representative set of blots documenting coimmunoprecipitation of WT versus Y124F Kv2.1 with the various trapping mutants used. Also shown are amounts of precipitating PTP and Kv2.1 expression in the crude lysates (second and third panels, respectively). (D) Bar diagram showing Y124F Kv2.1 coimmunoprecipitated with substrate-trapping D-to-A mutants normalized to protein content. Values (mean ± SEM) are relative to association of WT Kv2.1 with each phosphatase. D437A cyt-PTPα and D245A cyt-PTPε exhibit reduced binding to Y124F Kv2.1 compared with WT Kv2.1 (63.3 ± 10.4 and 55.5 ± 13.8%, respectively; p = 0.03–0.05; Welch's t test). In contrast, the membrane-bound mutants D437A RPTPα, D245A Lck-cyt-PTPε, and D302A RPTPε bind WT and Y124F Kv2.1 similarly.
Figure 8.
Figure 8.
Schematic model illustrating the distinct mechanisms by which cyt-PTPε and RPTPα regulate Src and Kv2.1 in Schwann cells. (A) Distinct modes of interaction with Kv2.1. Left, cyt-PTPε down-regulates Kv2.1 by dephosphorylating the channel protein at Y124 (dark dot). Right, in addition to dephosphorylating Kv2.1 at Y124, RPTPα inhibits Kv2.1 activity by interacting with the channel protein at other locations. One such hypothetical interaction is marked by the dashed line. (B) Differences in the PTP-Kv-Src triangle. Left, cyt-PTPε does not interact with Src in Schwann cells and acts only to counteractivation of Kv2.1 by Src-mediated phosphorylation at Y124. Right, RPTPα regulates Kv2.1 also, but not exclusively, by antagonizing Src activity at Y124 of Kv2.1. The overall inhibitory effect of RPTPα is stronger than that of cyt-PTPε. RPTPα can also dephosphorylate and activate Src, thereby contributing indirectly to activation of Kv2.1. Y124 is noted by the dark dot near the N terminus of Kv2.1. Dark rectangles represent the PTP domains of cyt-PTPε and RPTPα; in both cases, activity is associated mainly with the N terminal PTP domain, whereas the C terminal PTP domain performs mainly regulatory roles.

Similar articles

Cited by

References

    1. Alonso A., Sasin J., Bottini N., Friedberg I., Osterman A., Godzik A., Hunter T., Dixon J., Mustelin T. Protein tyrosine phosphatases in the human genome. Cell. 2004;117:699–711. - PubMed
    1. Andersen J. N., Elson A., Lammers R., Romer J., Clausen J. T., Moller K. B., Moller N. P. Comparative study of protein tyrosine phosphatase-epsilon isoforms: membrane localization confers specificity in cellular signalling. Biochem. J. 2001;354:581–590. - PMC - PubMed
    1. Andersen J. N., Jansen P. G., Echwald S. M., Mortensen O. H., Fukada T., Del Vecchio R., Tonks N. K., Moller N. P. A genomic perspective on protein tyrosine phosphatases: gene structure, pseudogenes, and genetic disease linkage. FASEB J. 2004;18:8–30. - PubMed
    1. Bjorge J. D., Pang A., Fujita D. J. Identification of protein-tyrosine phosphatase 1B as the major tyrosine phosphatase activity capable of dephosphorylating and activating c-Src in several human breast cancer cell lines. J. Biol. Chem. 2000;275:41439–41446. - PubMed
    1. Blanchetot C., Chagnon M., Dube N., Halle M., Tremblay M. L. Substrate-trapping techniques in the identification of cellular PTP targets. Methods. 2005;35:44–53. - PubMed

Publication types

MeSH terms

Substances

LinkOut - more resources