Randomized Controlled Trial
. 2006 Jul 26;26(30):7791-810.
doi: 10.1523/JNEUROSCI.0830-06.2006.

Control of fast-reaching movements by muscle synergy combinations

Affiliations
Randomized Controlled Trial

Control of fast-reaching movements by muscle synergy combinations

Andrea d'Avella et al. J Neurosci. .

Abstract

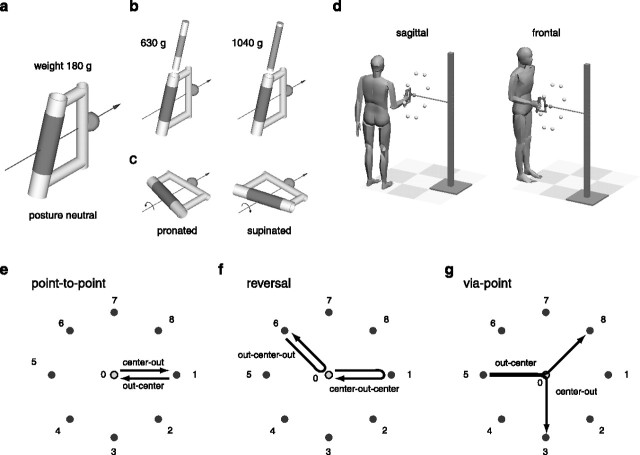
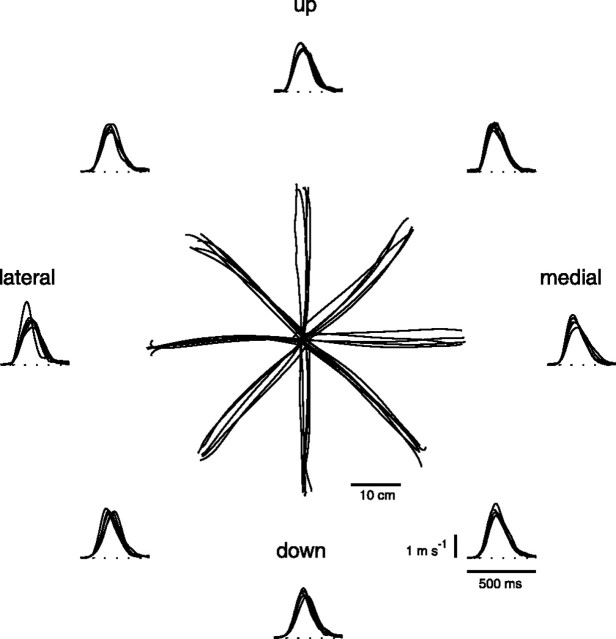
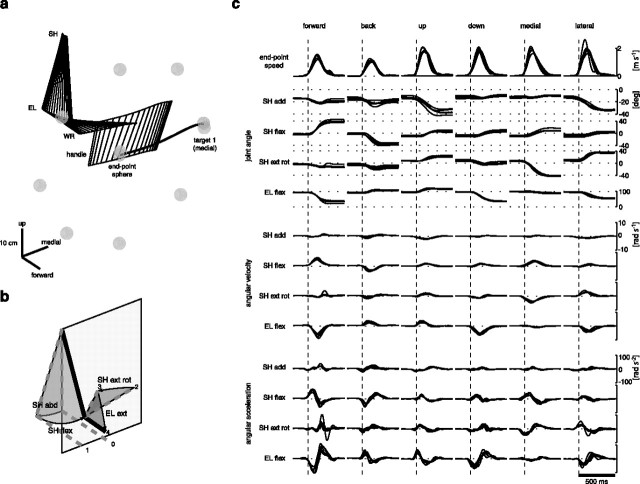
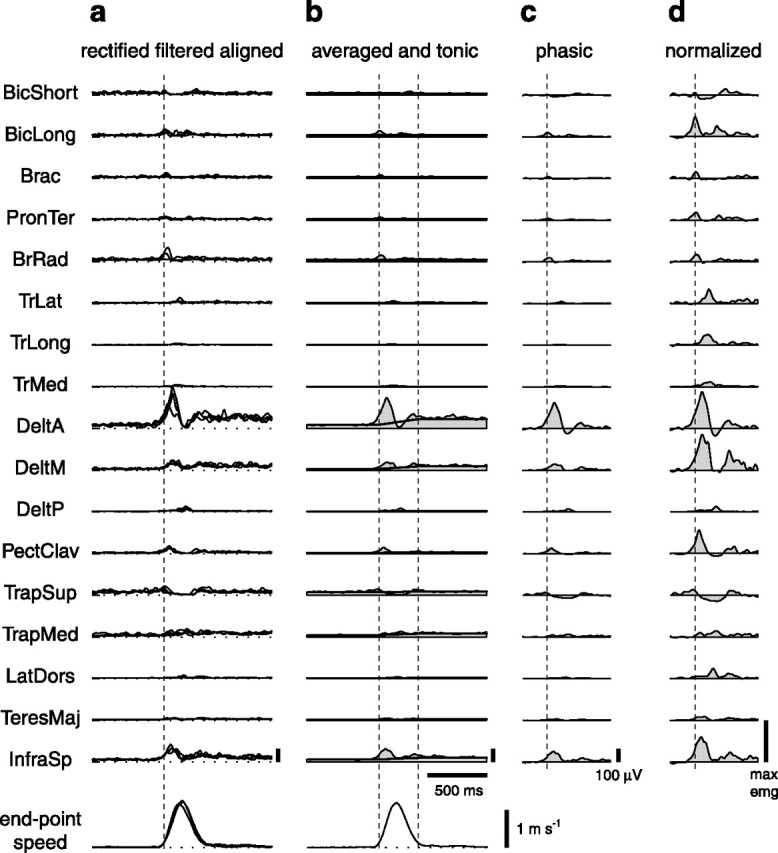
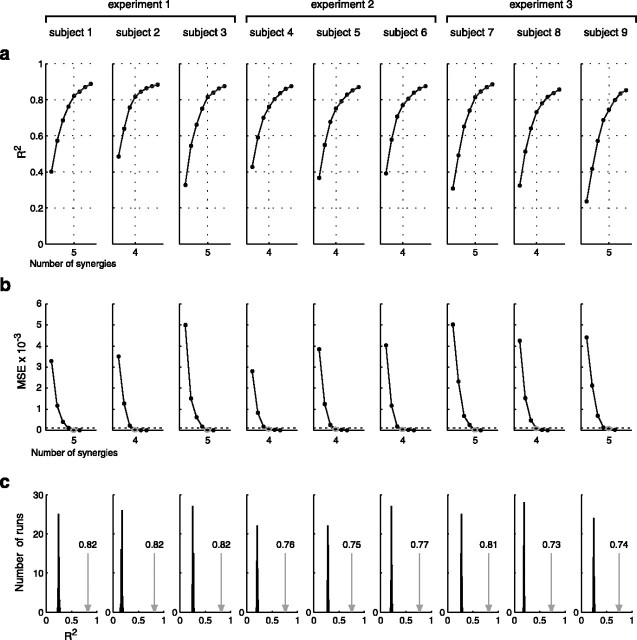
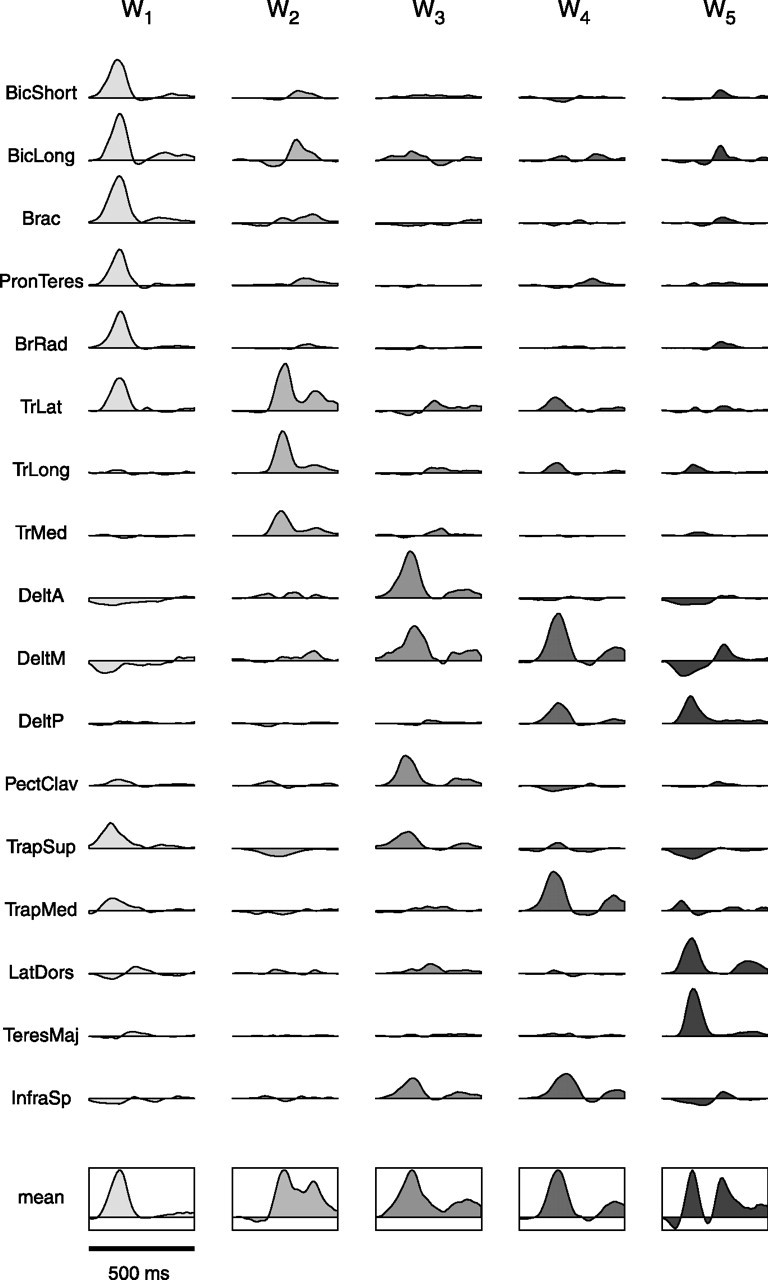
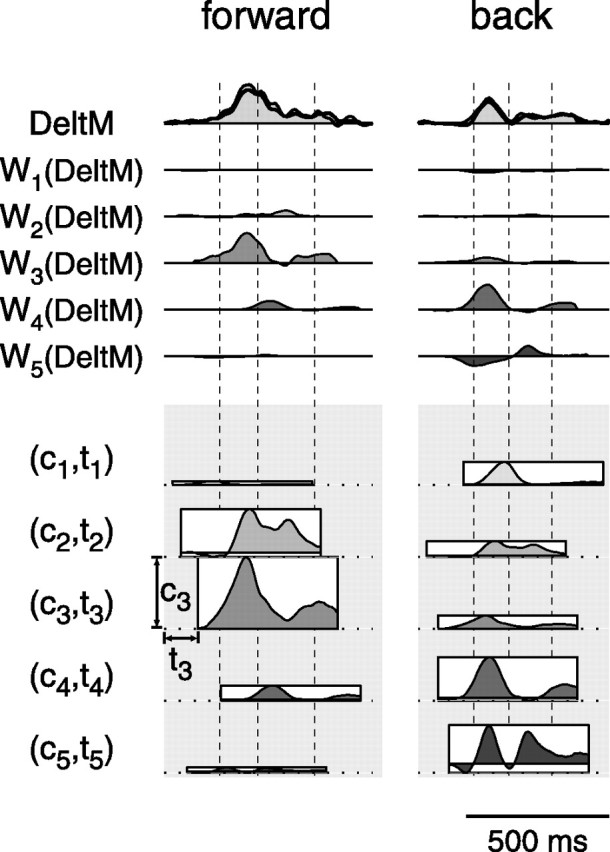
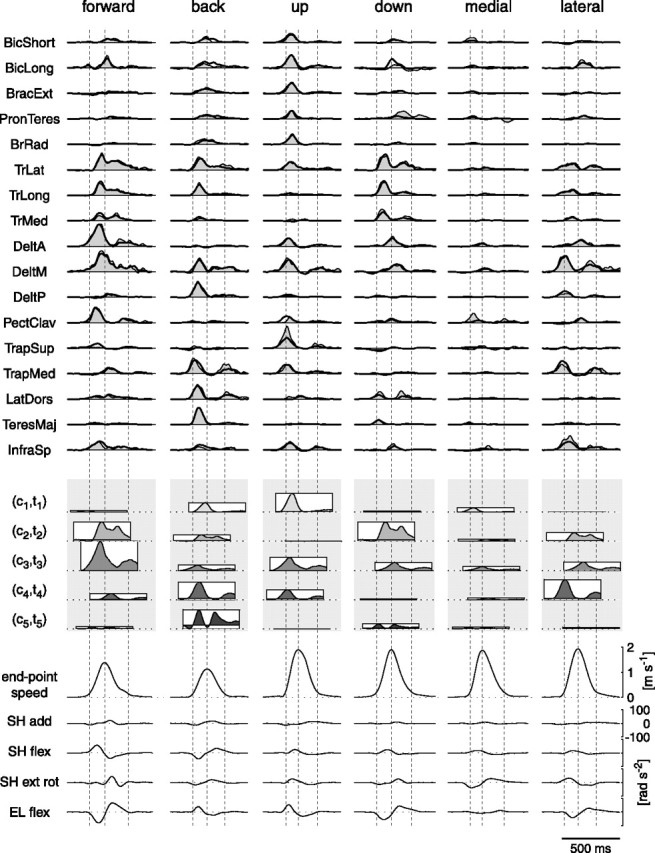
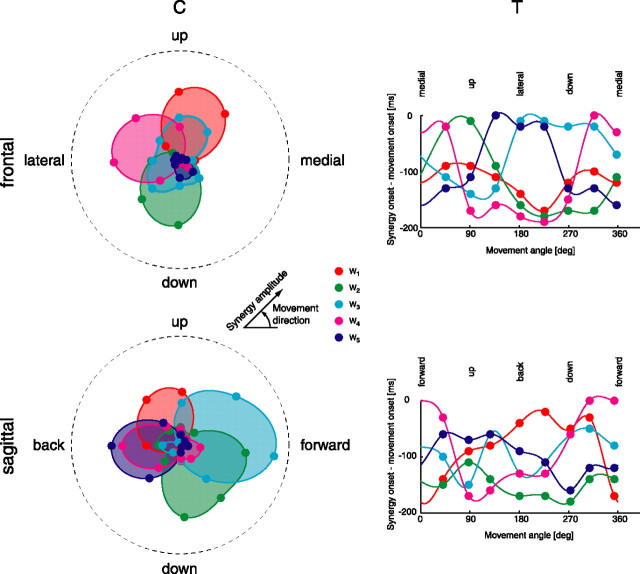
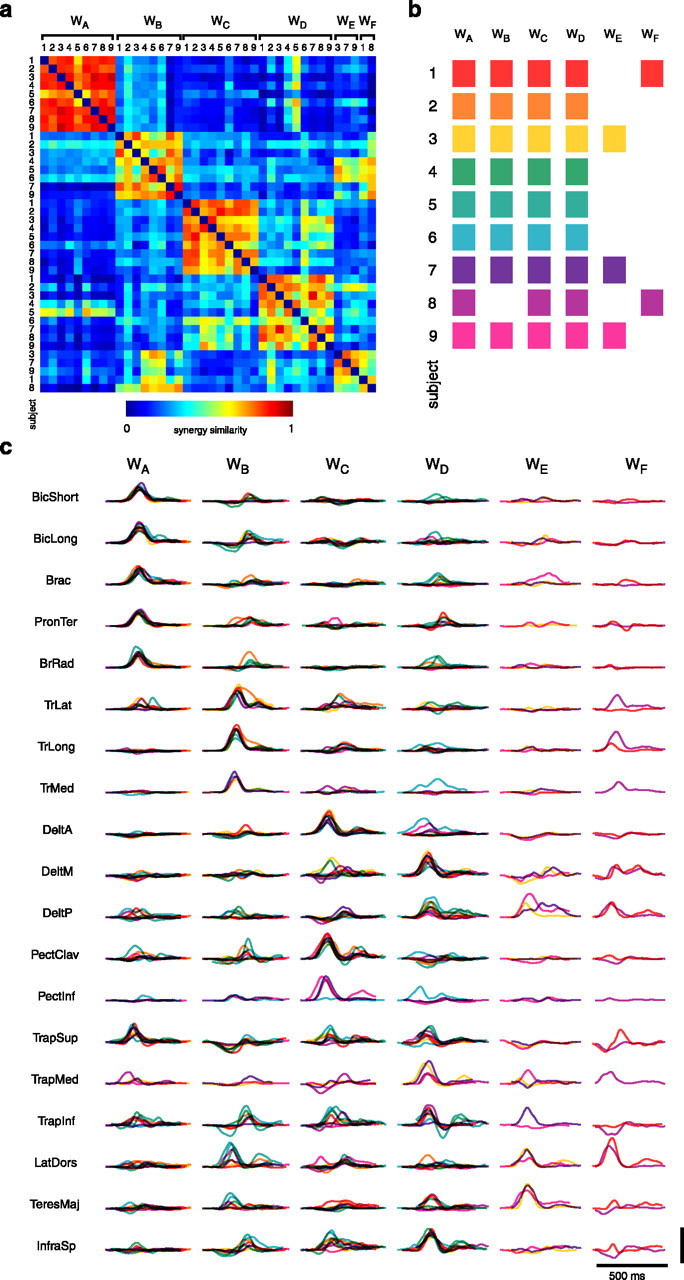
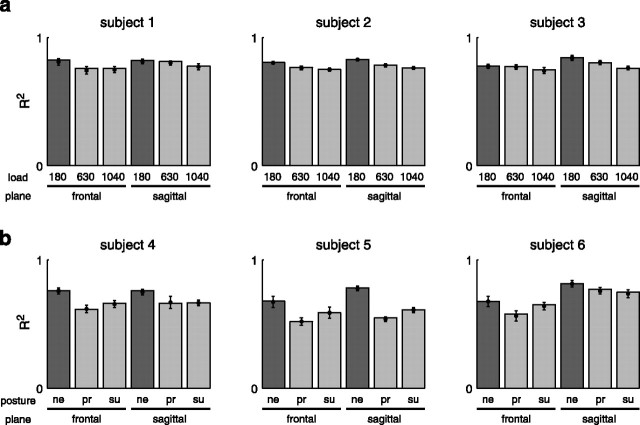
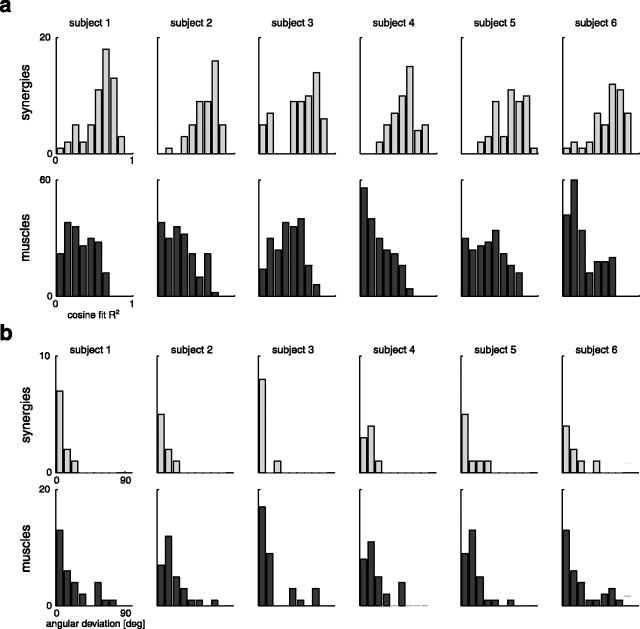
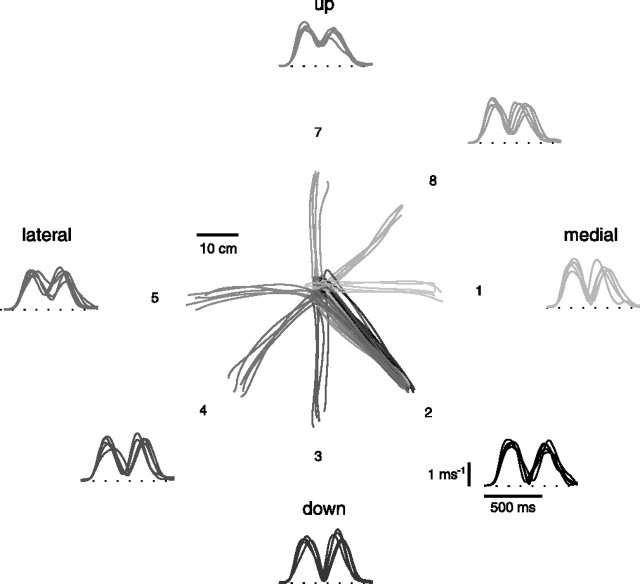
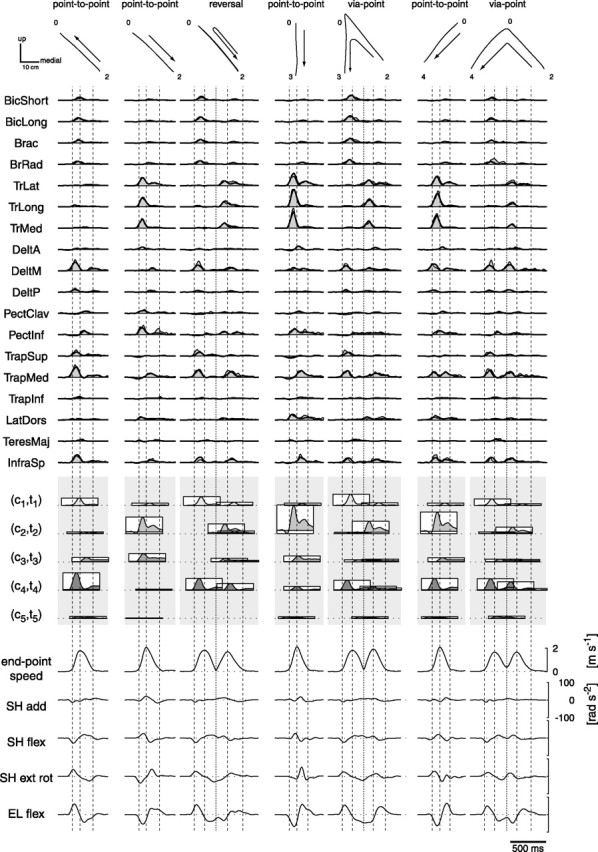
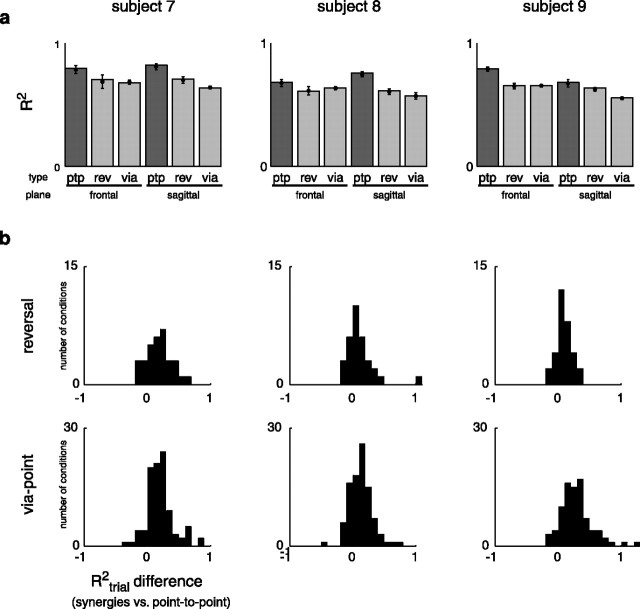
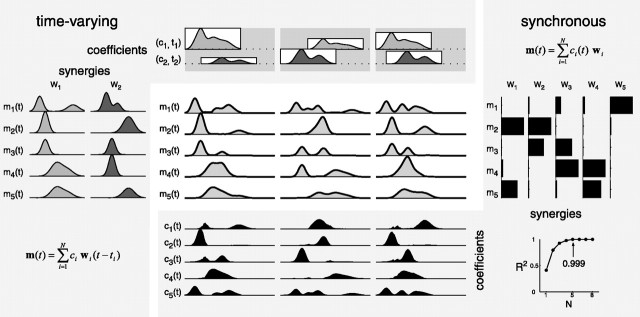
How the CNS selects the appropriate muscle patterns to achieve a behavioral goal is an open question. To gain insight into this process, we characterized the spatiotemporal organization of the muscle patterns for fast-reaching movements. We recorded electromyographic activity from up to 19 shoulder and arm muscles during point-to-point movements between a central location and 8 peripheral targets in each of 2 vertical planes. We used an optimization algorithm to identify a set of time-varying muscle synergies, i.e., the coordinated activations of groups of muscles with specific time-varying profiles. For each one of nine subjects, we extracted four or five synergies whose combinations, after scaling in amplitude and shifting in time each synergy independently for each movement condition, explained 73-82% of the data variation. We then tested whether these synergies could reconstruct the muscle patterns for point-to-point movements with different loads or forearm postures and for reversal and via-point movements. We found that reconstruction accuracy remained high, indicating generalization across these conditions. Finally, the synergy amplitude coefficients were directionally tuned according to a cosine function with a preferred direction that showed a smaller variability with changes of load, posture, and endpoint than the preferred direction of individual muscles. Thus the complex spatiotemporal characteristics of the muscles patterns for reaching were captured by the combinations of a small number of components, suggesting that the mechanisms involved in the generation of the muscle patterns exploit this low dimensionality to simplify control.


Figures

Figure 1.
Figure 1.
Experimental apparatus and conditions. Subjects gripped a custom-made plastic handle with a reference sphere attached on its side (a). In experiment 1, the weight of the handle was varied by inserting a load (b) into the gripping cylinder, thus requiring the subject to carry one of three weights (180, 630, and 1040 g). In experiment 2, subjects were instructed to hold the handle either vertically or horizontally (c) after either a clockwise or counterclockwise rotation of the forearm, thus requiring one of three forearm postures (neutral, pronated, and supinated). Standing subjects performed fast-reaching movements from a fixed starting position (corresponding to a posture with the arm vertical along the body and the forearm horizontal) to eight targets in the sagittal plane and eight targets in the frontal plane (center-out movements) and fast-reaching movements from the peripheral targets back to the starting position (out-center movements) (d,e). In experiment 3, subjects also performed reaching movements with a reversal (f) and through a via-point (g) with the unloaded handle in the neutral posture.
Figure 2.
Figure 2.
Example of endpoint kinematics of point-to-point movements. Trajectories and tangential velocity profiles of the endpoint are shown for five repetitions of fast center-out movements to eight targets in the frontal plane (subject 3; 180 g load; neutral forearm posture).
Figure 3.
Figure 3.
Example of joint kinematics of point-to-point movements. Joint rotation angles for the shoulder and the elbow joints were computed from the position in space of three markers placed on the arm and forearm. a, The stick figure shows the orientation in space of the upper arm, forearm, and gripping cylinder handle during one movement from the central location to target 1 in the frontal plane (the positions of the central location, of the eight peripheral targets, and of the endpoint at the onset and end of the movement are indicated by gray spheres). SH, Shoulder; EL, elbow; WR, wrist. b, Three shoulder angles (adduction, flexion, and external rotation) and one elbow angle (flexion) were computed as the angles associated with the sequence of single-axis rotations necessary to reach the posture from a reference posture (0–4). Note that a positive shoulder abduction (SH abd), corresponding to a negative shoulder adduction (SH add), is illustrated in the figure. c, Endpoint speed, joint angles, velocities, and accelerations for five repetitions of six center movements in the sagittal and frontal plane (subject 3; 180 g load; neutral posture). flex, Flexion; ext rot, external rotation; rad, radius; deg, degree.
Figure 4.
Figure 4.
Estimation of phasic EMG patterns. The rectified and filtered EMGs for all repetitions of the same movement (a) were aligned to the time of movement onset and averaged (b, thin line and shaded area). For each muscle, the phasic EMG waveform (c) was constructed by subtracting a linear ramp from the tonic level of that muscle before movement onset to the tonic level after movement end (b, thick line) to the average EMG. Each muscle was then normalized to the maximum of that muscle over all conditions (d) (see Materials and Methods). Abbreviations for muscles are shown in Table 1.
Figure 5.
Figure 5.
Synergy extraction. a, Total variation explained as a function of the number of extracted synergies. The curve showing the percentage of the total variation explained by the synergy combinations (R2) as a function of the number of extracted synergies has a change in slope at four or five synergies (dotted vertical line) depending on the subject (different columns). b, Selection of number of synergies. For each subject, the number of synergies to consider for further analysis was determined as the number for which the mean squared error (MSE) of a linear regression of the portion of the R2 curve starting from a given number of synergies (1–6) up to the end of the curve (8 synergies) drops below 10−4 (dashed horizontal line). c, Significance of extracted synergies. Each histogram shows the distribution of the R2 values for the reconstruction of simulated, structureless data with synergies extracted from those simulated data over 50 simulation runs, compared with the R2 value for the reconstruction of the real runs with the synergies extracted from them (arrow) (see Materials and Methods).
Figure 6.
Figure 6.
Five time-varying synergies extracted from the muscle patterns of subject 3. Each synergy (W1 to W5) represents the activation of all of the muscles for 500 ms, with a specific set of muscle activation waveforms for each synergy. The last row shows the mean muscle activation waveform for each synergy (framed in a rectangle). Abbreviations for muscles are shown in Table 1.
Figure 7.
Figure 7.
Synergy combination mechanism. The reconstruction of a single muscle activation waveform [medial deltoid (DeltM); first row, thin line and shaded area] in two different movements (different columns; subject 3; center-out; 180 g load) illustrates the mechanism used to construct muscle patterns through the combination of time-varying synergies. For each movement, the synergy activation waveform for each of the five synergies (2nd to 6th row, labeled W1 to W5; corresponding to the five waveforms in the DeltM row of Fig. 6) are scaled in amplitude and shifted in time according to movement-specific coefficients (ci and ti; i = 1, …, 5; see Materials and Methods) and summed together (first row, thick line). The values of the coefficients are illustrated in the bottom panel using five rectangles. The height of each rectangle represents the amplitude coefficient for one synergy; its horizontal position corresponds to the time of the synergy recruitment. The profile inside each rectangle represents the mean of the muscle activation waveforms in the synergy (Fig. 6, bottom row), and it is shown only to better visualize the synergy recruitment timing. Note how the activation of the same muscle in different movements depends on the recruitment of different synergy combinations (mainly W2 and W3 in forward movements; mainly W4 and W5 in backward movements). Moreover, the specific shape and timing of the muscle activation waveform depend on the amplitude scaling and time shifting of the different synergy waveforms.
Figure 8.
Figure 8.
Example of reconstruction of the muscle patterns by synergy combination across movement conditions. The averaged, rectified, filtered, and integrated phasic EMGs are reconstructed by scaling in amplitude and shifting in time five time-varying synergies (Fig. 6). The observed data (top panel, thin line and shaded area) and their reconstruction (thick line) as combinations of the five synergies (where the amplitude and timing coefficients are illustrated by the height and position of rectangles, as in Fig. 7) are shown for two directions in the sagittal plane (forward and back), two directions common to sagittal and frontal planes (up and down), and two directions in the frontal plane (medial and lateral) (subject 3; center-out; 180 g load). For each direction, dashed vertical lines represent the movement onset time, the time of maximum speed, and movement end time. The bottom panel shows the endpoint speed profiles and the angular accelerations for each movement. SH, Shoulder; EL, elbow; rad, radius; add, adduction; flex, flexion; ext rot, extension rotation. Abbreviations for muscles are shown in Table 1.
Figure 9.
Figure 9.
Synergy directional tuning. Synergy amplitude coefficients (C, left column) and timing coefficients (T, right column) for movements in the frontal (top row) and sagittal (bottom row) planes are shown for subject 3 (center-out; 180 g load; neutral posture). In both amplitude polar plots (left column) and timing plots (right column), the eight values of the coefficients for each synergy (colored dots) are connected by a periodic cubic spline interpolation curve. deg, Degree.
Figure 10.
Figure 10.
Synergy comparison across subjects. We used a hierarchical clustering algorithm to group the 40 synergies extracted from all nine subjects into groups according to their similarity. The hierarchal cluster tree generated from the similarity matrix (a) was partitioned into six clusters (b) representing the minimum number of clusters for which there was no more than one element from the same subject in each cluster. The synergies in each cluster (c) show common distinctive features (see Results). In b and c, each subject is identified by a different color.
Figure 11.
Figure 11.
Robustness of synergies across dynamic and postural conditions. The fraction of total data variation explained by the reconstruction of the data collected with different loads (a, experiment 1; 180, 630, and 1040 g) and different forearm postures (b, experiment 2; ne, neutral; pr, pronated; su, supinated) with the synergies extracted from point-to-point patterns with the unloaded handle and neutral posture (light gray bars) is close to the fraction of the total data variation explained by the reconstruction of the data used for the synergy extraction (dark gray bars), indicating a significant degree of generalization across dynamic and postural conditions. The mean and SD of the R2 values obtained over 100 subsets of 50% of the trials that were randomly selected in each condition (bootstrap statistics) are superimposed over the bar representing the R2 values for 100% of the trials.
Figure 12.
Figure 12.
Cosine tuning for synergy amplitude coefficients and for largest muscle bursts. In most cases, the dependence of the synergy amplitude coefficients on the direction of movement was well captured by a cosine function with an offset (see Materials and Methods). The distribution of R2 values of the cosine fit over all conditions (3 loads or postures times; 2 endpoints) and synergies (a, top row, light gray bars) had a median, for each subject in experiment 1 (subjects 1–3) and experiment 2 (subjects 4–6), significantly higher than the median of the distribution of the R2 values of the cosine fit, over all conditions and muscles, of the amplitude of the largest 100 ms EMG burst (a, bottom row, dark gray bars). Moreover, the preferred direction of the cosine tuning was less variable, across conditions, for the synergies than for the muscles. The distribution of the angular deviations, across load or posture and endpoint conditions, for each synergy and plane of movement (b, top row, light gray bars) had a smaller median than the distribution of the angular deviations for each muscle and plane (b, bottom row, dark gray bars). deg, Degree.
Figure 13.
Figure 13.
Example of reversal and via-point movement endpoint kinematics. Trajectories and tangential velocity profiles of the endpoint are shown for five repetitions of reversal and via-point movements starting from a medial-inferior position on the frontal plane (location 2), reaching the central position, and either returning to the same start position (reversal, darkest lines) or reaching different targets located at an angle ranging from 135° (location 3) to −135° (location 1) with the exception of 0° (via-point, progressively lighter gray lines going from negative to positive deviation angles). All tangential velocity profiles show two distinct maxima.
Figure 14.
Figure 14.
Example of reversal and via-point muscle pattern reconstruction with point-to-point synergies. Trajectories, averaged phasic muscle patterns, synergy reconstruction, synergy combination coefficients, endpoint tangential velocity, and angular accelerations are shown (different rows) for one reversal movement (3rd column) and two via-point movements (5th and 7th columns) with the same first phase (as in the point-to-point movement in the 1st column) and different second phases (as in the point-to-point movements in the 2nd, 4th, and 6th columns). The muscle patterns for the more complex movements resemble a superposition, after time shift, of the patterns for point-to-point movements but with changes in the amplitude and time of individual muscles. SH, Shoulder; EL elbow; add, adduction; flex, flexion; ext rot, external rotation; rad, radius. Abbreviations for muscles are shown in Table 1.
Figure 15.
Figure 15.
Robustness of point-to-point synergies for reversal and via-point movements. a, The fraction of total data variation explained by the reconstruction of the reversal and via-point data (experiment 3) with the synergies extracted from point-to-point muscle patterns (light gray bars) is close to the fraction of the total data variation explained by the reconstruction of the point-to-point data used for the synergy extraction (dark gray bars), suggesting that complex movements are constructed by sequencing and modulating the same synergies used for point-to-point movements. For each condition, the superimposed mean and SD are obtained from bootstrap statistics as in Figure 11. b, The distribution of the differences between the fraction of the total data variation per unit sample explained in each reversal and via-point trial by the synergy reconstruction and the reconstruction obtained by fitting the corresponding point-to-point muscle patterns, shifted in time to align the tangential velocity peaks, has a median significantly higher than zero, indicating that the point-to-point muscle patterns are adjusted by modulating individual synergies to generate these more complex movements. ptp, Point-to-point; rev, reversal; via, via-point.
Figure 16.
Figure 16.
Differences between time-varying and synchronous synergies. A simple simulation illustrates the fact that invariant temporal relationships among muscle bursts can be captured explicitly by time-varying muscle synergies but only implicitly by synchronous synergies. Three distinct muscle patterns (center panel, gray areas) are generated by combining two time-varying synergies (left panel; W1 and W2) with different amplitude scaling (ci) and time shifting (ti) coefficients (top panel; represented, as in Figs. 7 and 13, by the height and position of different rectangles). These patterns are then decomposed with a non-negative matrix factorization algorithm (Lee and Seung, 2001) to extract synchronous synergies. Because no noise was added to the patterns, the R2 reaches 1 at five synergies (bottom right panel), i.e., five synchronous synergies (right panel, black horizontal bars; each column is a vector representing the muscle activation balance of each synchronous synergy) are required to reconstruct the patterns (central panel, thick black line). These synchronous synergies capture the synchronous amplitude relationships characteristic of the generating time-varying synergies, but they cannot capture the whole spatiotemporal organization. The temporal organization in the muscle patterns is expressed only indirectly by the organization of the time-varying scaling coefficients for the synchronous synergies (bottom panel).

References

    1. Bartlett MS (1950). Tests of significance in factor analysis. Br J Psychol 3:77–85.
    1. Basilevsky A (1994). In: Statistical factor analysis and related methods: theory and applications New York: Wiley.
    1. Bastian AJ, Martin TA, Keating JG, Thach WT (1996). Cerebellar ataxia: abnormal control of interaction torques across multiple joints. J Neurophysiol 76:492–509. - PubMed
    1. Batschelet E (1981). In: Circular statistics in biology London: Academic.
    1. Bhushan N, Shadmehr R (1999). Computational nature of human adaptive control during learning of reaching movements in force fields. Biol Cybern 81:39–60. - PubMed

Publication types