. 2006 Jul 26;26(30):7849-59.
doi: 10.1523/JNEUROSCI.1526-06.2006.

Tenascin-R restricts posttraumatic remodeling of motoneuron innervation and functional recovery after spinal cord injury in adult mice

Affiliations

Tenascin-R restricts posttraumatic remodeling of motoneuron innervation and functional recovery after spinal cord injury in adult mice

Ivayla Apostolova et al. J Neurosci. .

Abstract

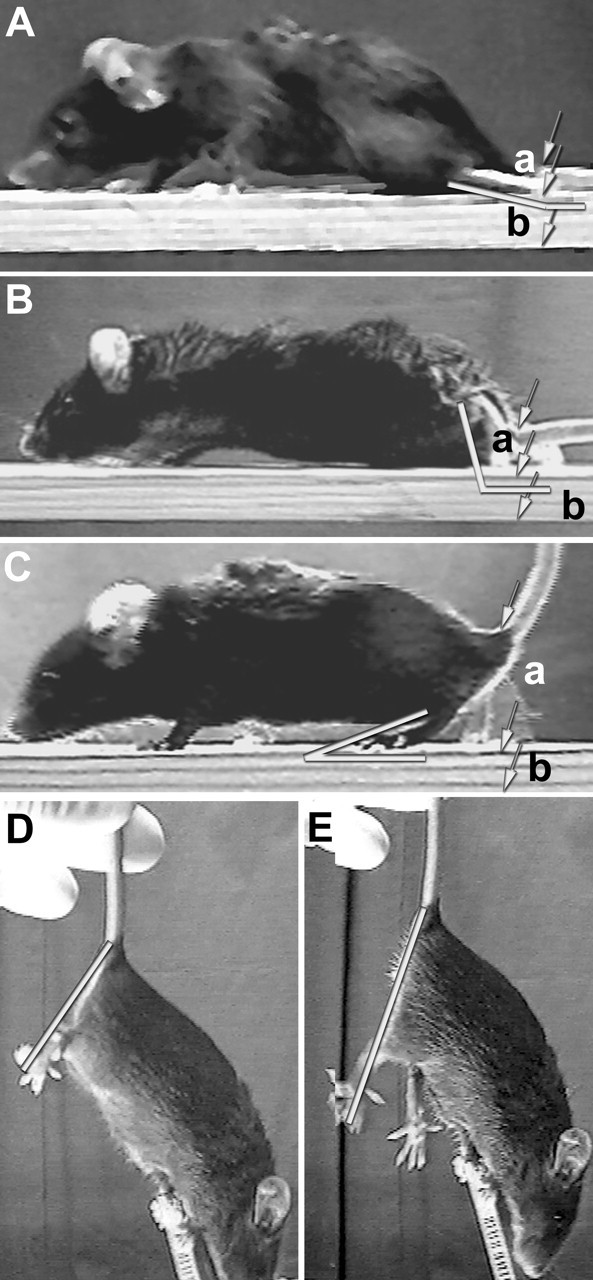
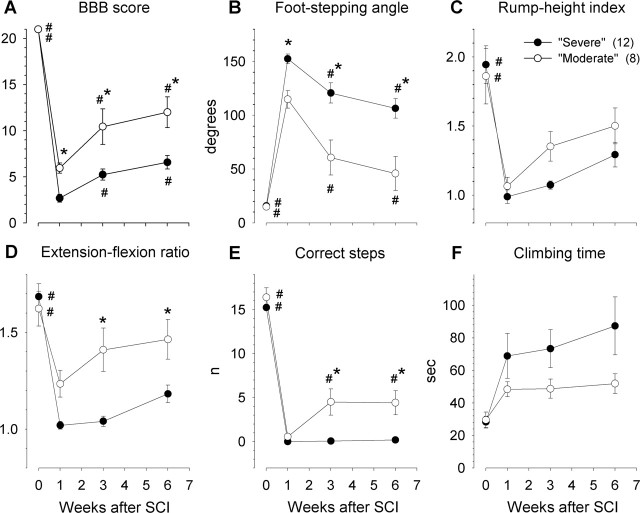
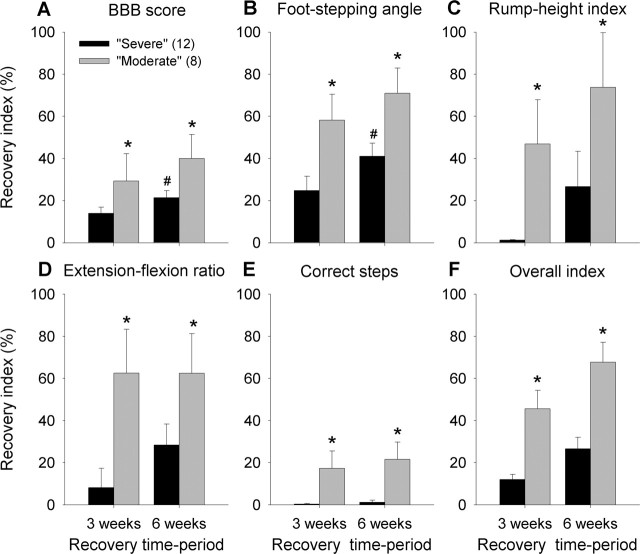
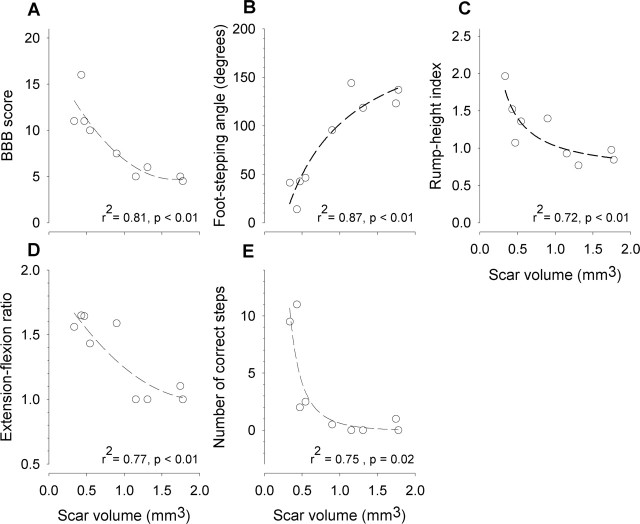
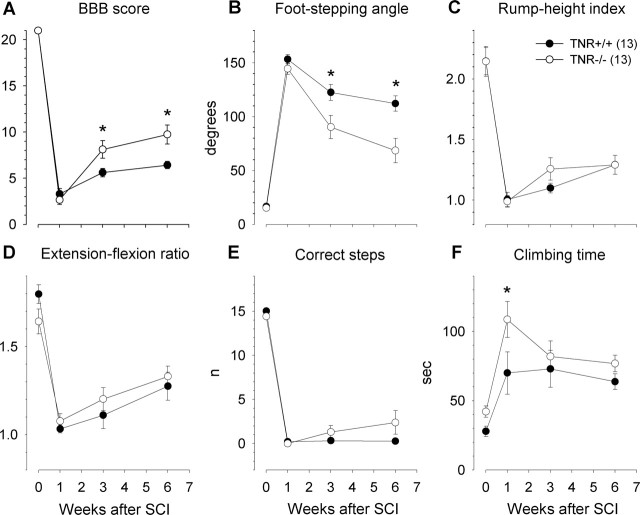
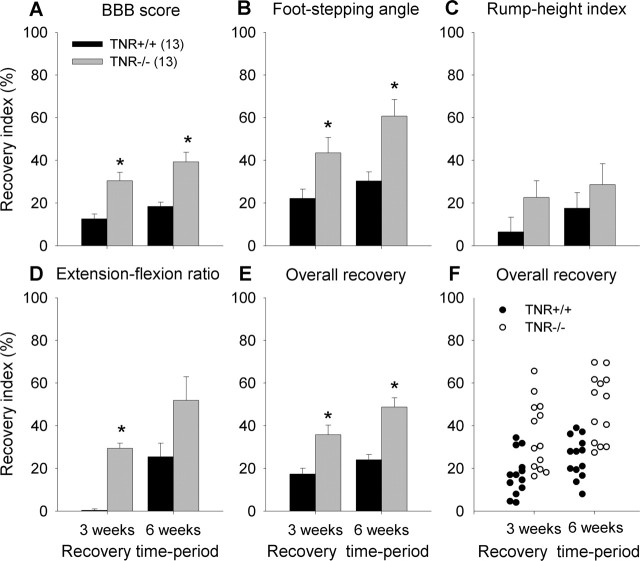
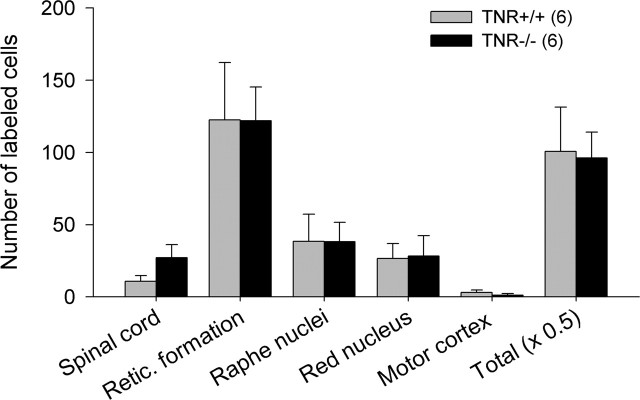
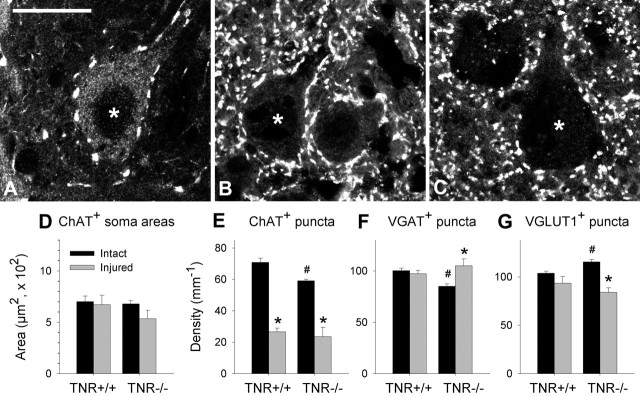
Tenascin-R (TNR) is an extracellular glycoprotein in the CNS implicated in neural development and plasticity. Its repellent properties for growing axons in a choice situation with a conducive substrate in vitro have indicated that TNR may impede regeneration in the adult mammalian CNS. Here we tested whether constitutive lack of TNR has beneficial impacts on recovery from spinal cord injury in adult mice. Using the Basso, Beattie, Bresnahan (BBB) locomotor rating scale, we found that open-field locomotion in TNR-deficient (TNR-/-) mice recovered better that in wild-type (TNR+/+) littermates after compression of the thoracic spinal cord. We also designed, validated, and applied a motion analysis approach allowing numerical assessment of motor functions. We found, in agreement with the BBB score, that functions requiring low levels of supraspinal control such as plantar stepping improved more in TNR-/- mice. This was not the case for motor tasks demanding precision such as ladder climbing. Morphological analyses revealed no evidence that improved recovery of some functions in the mutant mice were attributable to enhanced tissue sparing or axonal regrowth. Estimates of perisomatic puncta revealed reduced innervation by cholinergic and GABAergic terminals around motoneurons in intact TNR-/- compared with TNR+/+ mice. Relative to nonlesioned animals, spinal cord repair was associated with increase in GABAergic and decrease of glutamatergic puncta in TNR-/- but not in TNR+/+ mice. Our results suggest that TNR restricts functional recovery by limiting posttraumatic remodeling of synapses around motoneuronal cell bodies where TNR is normally expressed in perineuronal nets.


Figures

Figure 1.
Figure 1.
Single-frame motion analysis. Single frames of video sequences recorded during beam walking (A–C) and voluntary movements without body weight support (pencil test; D, E) of mice subjected to severe (A, B) or moderate (C–E) spinal cord compression. The animals were video recorded at 1 (A), 3 (B), and 6 (C–E) weeks after injury. The foot-stepping angle, measured with respect to caudal, is drawn in A–C. The lengths of the distances a and b between the arrows were used to calculate the rump-height index. D and E show a phase of maximum hindlimb flexion (D) immediately followed by a maximum extension (E). The lengths of the lines drawn in the pictures were used to determine the extension–flexion ratio.
Figure 2.
Figure 2.
Time course and degree of functional recovery after moderate and severe spinal cord compression in C57BL/6J mice. Shown are mean ± SEM values of open-field locomotion (BBB) scores (A), foot-stepping angles (B), rump-height indices (C), extension–flexion ratios (D), numbers of correct steps (E), and ladder-climbing time (F) before surgery (day 0) and at 1, 3, and 6 weeks after SCI. Numbers of mice studied per group are given in C. Symbols indicate significant differences between group mean values at a given time period (*) or from the within-group value at 1 week after injury (#) (p < 0.05, one-way ANOVA for repeated measurements with Tukey’s post hoc test).
Figure 3.
Figure 3.
Recovery indices after moderate and severe spinal cord compression in C57BL/6J mice. Shown are mean values ± SEM of individual recovery indices at 3 and 6 weeks after injury calculated for BBB scores (A), foot-stepping angles (B), rump-height ratios (C), extension–flexion ratios (D), and numbers of correct steps (E). The mean overall indices shown in F are calculated from individual averaged indices for the parameters shown in A–E. Numbers of mice studied per group are given in A. Symbols indicate group mean values different from that of severely injured mice (*) and from the within-group value at 3 weeks (#) (p < 0.05, one-way ANOVA with Tukey’s post hoc test).
Figure 4.
Figure 4.
Correlations between functional parameters and scar volume in C57BL/6J mice. A–E, Scatter plots of individual values for BBB score (A), foot-stepping angle (B), rump-height index (C), extension–flexion ratio (D), and number of correct steps (E) with regression lines, coefficients of determination (r2), and ANOVA probability values (p) calculated by nonlinear regression analyses. During spinal cord injury, compression forces of 50, 75, or 100% of maximum were applied in individual mice to produce different degrees of lesion within this animal group. Scar volume was estimated from spaced serial sections using the Cavalieri principle.
Figure 5.
Figure 5.
Time course and degree of functional recovery in TNR-deficient (TNR−/−) mice and wild-type (TNR+/+) littermates after severe spinal cord compression. Shown are mean values ± SEM of open-field locomotion (BBB) scores (A), foot-stepping angles (B), rump-height indices (C), extension–flexion ratios (D), numbers of correct steps (E), and ladder-climbing time (F) before surgery (day 0) and at 1, 3, and 6 weeks after injury. Numbers of mice studied per group are given in C. Asterisks indicate significant differences between group mean values at a given time period (p < 0.05, one-way ANOVA for repeated measurements with Tukey’s post hoc test).
Figure 6.
Figure 6.
Recovery indices in TNR−/− and TNR+/+ mice. Shown are mean values ± SEM of individual recovery indices at 3 and 6 weeks after injury calculated for BBB scores (A), foot-stepping angles (B), rump-height ratios (C), and extension–flexion ratios (D). Group mean values and individual values of overall recovery indices (calculated as means of the values for the parameters shown in A–D) are shown in E and F, respectively. Numbers of mice studied per group are given in A. Asterisks indicate values different from that of TNC+/+ mice (p < 0.05, one-way ANOVA with Tukey’s post hoc test).
Figure 7.
Figure 7.
Neurons projecting beyond the lesion site in TNR−/− and TNR+/+ mice. Shown are mean ± SEM numbers of labeled neuronal cell profiles seen in the cervical spinal cord and different brain areas in spaced serial sections 250 μm apart 2 weeks after application of tracer caudal to the lesion site. Numbers of mice studied per group are given in parentheses at the top. No differences between the group mean values were observed (p > 0.05, two-sided t test for independent samples).
Figure 8.
Figure 8.
Analysis of perisomatic puncta. Confocal images (1-μm-thick optical slices) show the appearance of ChAT+ (A), VGAT+ (B), and VGLUT1+ (C) puncta around motoneuron cell bodies (asterisks) in sections from intact TNR−/− (A) and TNR+/+ (B, C) mice. Scale bar: A–C, 25 μm. D–G, Soma area of ChAT+ motoneurons (D) and linear densities of ChAT+ (E), VGAT+ (F), and VGLUT1+ (G) puncta surrounding motoneurons identified by ChAT staining (A) or by size of the cell somata (B, C) and nuclei (data not shown). Shown are group mean ± SEM values calculated from individual mean values. The numbers of injured/intact TNR−/− and TNR+/+ mice studied were six/four and four/four, respectively. Between 110 and 160 cells were analyzed per group and parameter. Symbols indicate group mean values significantly different from intact animals of the same genotype (*) or from intact TNR+/+ mice (#) (p < 0.05, two-sided t test for independent samples, degrees of freedom determined by the number of mice studied).

Similar articles

Cited by

References

    1. Angelov DN, Walther M, Streppel M, Guntinas-Lichius O, Neiss WF, Probstmeier R, Pesheva P (1998). Tenascin-R is antiadhesive for activated microglia that induce downregulation of the protein after peripheral nerve injury: a new role in neuronal protection. J Neurosci 18:6218–6229. - PMC - PubMed
    1. Basso DM (2004). Behavioral testing after spinal cord injury: congruities, complexities, and controversies. J Neurotrauma 21:395–404. - PubMed
    1. Basso DM, Beattie MS, Bresnahan JC (1995). A sensitive and reliable locomotor rating scale for open field testing in rats. J Neurotrauma 12:1–21. - PubMed
    1. Basso DM, Beattie MS, Bresnahan JC, Anderson DK, Faden AI, Gruner JA, Holford TR, Hsu CY, Noble LJ, Nockels R, Perot PL, Salzman SK, Young W (1996). MASCIS evaluation of open field locomotor scores: effects of experience and teamwork on reliability. Multicenter Animal Spinal Cord Injury Study. J Neurotrauma 13:343–359. - PubMed
    1. Becker CG, Becker T, Meyer RL, Schachner M (1999). Tenascin-R inhibits the growth of optic fibers in vitro but is rapidly eliminated during nerve regeneration in the salamander Pleurodeles waltl. J Neurosci 19:813–827. - PMC - PubMed

Publication types