. 2006 Jul 26;26(30):7898-906.
doi: 10.1523/JNEUROSCI.1327-06.2006.

Robust integration of motion information in the fly visual system revealed by single cell photoablation

Affiliations

Robust integration of motion information in the fly visual system revealed by single cell photoablation

Julia Kalb et al. J Neurosci. .

Abstract

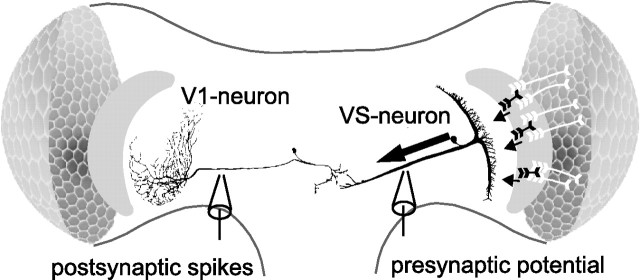
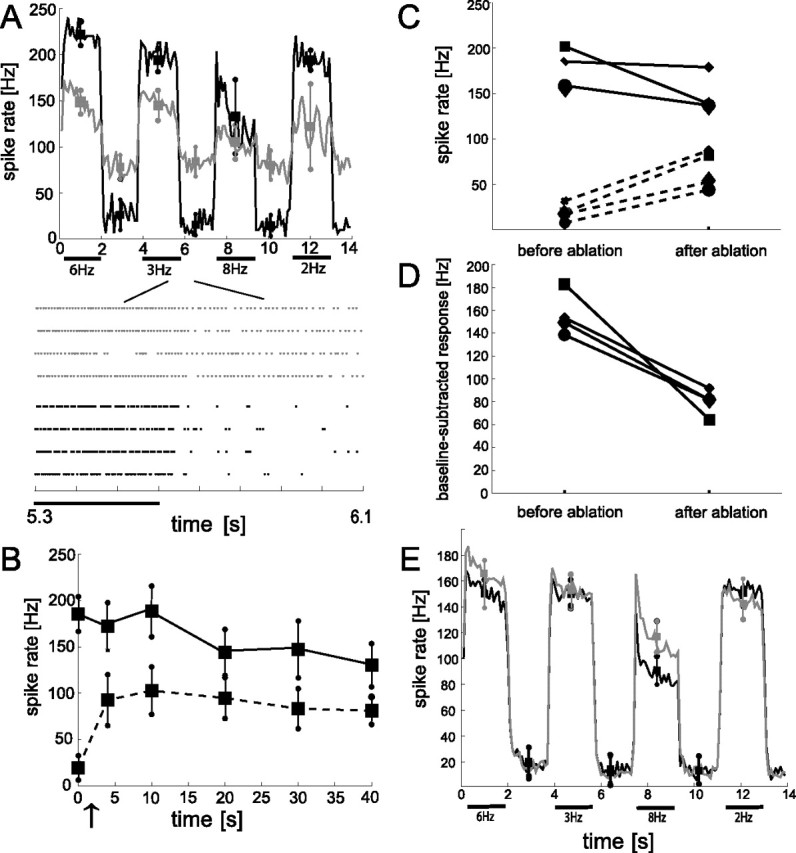
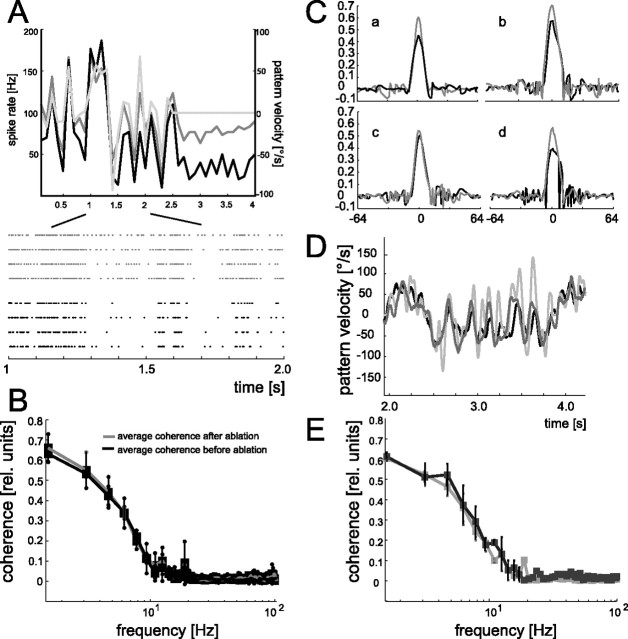
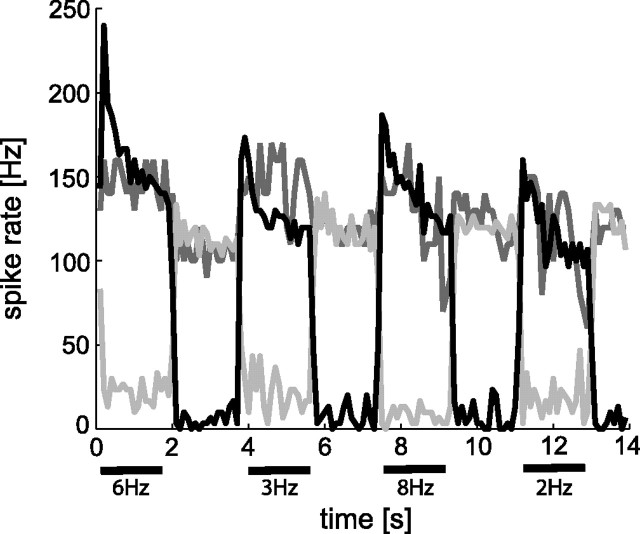
In the brain, sensory information needs often to be read out from the ensemble activity of presynaptic neurons. In the most basic case, this may be accomplished by an individual postsynaptic neuron. In the visual system of the blowfly, an identified motion-sensitive spiking neuron is known to be postsynaptic to an ensemble of graded-potential presynaptic input elements. Both the presynaptic and postsynaptic neurons were shown previously to be capable of representing the velocity of preferred-direction motion reliably and linearly over a large frequency range of velocity fluctuations. Accordingly, the synaptic transfer properties of the connecting excitatory synapses between individual input elements and the postsynaptic neuron were shown to be linear over a similar range of presynaptic membrane potential fluctuations. It was not known, however, how the postsynaptic neuron integrates and reads out the presynaptic ensemble activity. We were able to compare the response properties of the integrating cell before and after eliminating individual presynaptic elements by a laser ablation technique. For most of the input elements, we found that their elimination strongly affected the activity of the postsynaptic neuron but did not degrade its performance to encode motion with constant and time-varying velocity. Our results suggest that the integration of individual synaptic inputs within the neural circuit operates with some redundancy. This feature might help the postsynaptic neuron to encode in a highly robust way the direction and the velocity of self-motion of the animal.


Figures

Figure 1.
Figure 1.
Schematic of the neural circuit with one presynaptic VS cell, VS2, and the postsynaptic V1 cell. V1 integrates motion signals from at least four presynaptic VS cells and transforms them into spike activity, which is conveyed to the contralateral brain hemisphere.
Figure 2.
Figure 2.
Changes in the response characteristic of V1 during constant-velocity motion stimulation before and after selective ablation of a VS2/3 cell. A, Top, Average response amplitudes of a sample V1 before (black line) and 40 min after (gray line) ablation of a VS2/3 cell. Black bars indicate the pattern motion. The pattern moved with four different velocities corresponding to the indicated temporal frequencies. Each motion presentation lasted 1.9 s separated by a 1.7 s interval with a stationary pattern. Response amplitudes were binned into 100 ms time windows and averaged over four stimulus repetitions. Squares and circles denote means and SDs of motion-induced and baseline activity of V1, respectively. Motion-induced means and SDs were determined 100 ms after motion onset within 1.5 s windows. Correspondingly, we calculated the means of baseline activity in 1.5 ms windows starting 100 ms after the cessation of each motion presentation. Bottom, Raster plots of the corresponding responses before (black dots) and after (gray dots) ablation. Each dot denotes the occurrence of a V1 spike. B, Time course of both the average baseline activity (data points connected by the dashed line) and the motion-induced activity (data points connected by the solid line) of V1 relative to the time of VS2/3 ablation. The arrow indicates the time of ablation. Error bars indicate SD over four individual traces. The average responses were calculated in the time windows as specified in A. C, Summarized changes in average baseline (dashed lines) and motion-induced (solid lines) activity of V1 after VS2/3 ablation. The data are based on four ablation experiments with individual experiments indicated by different symbols. The cell shown in A and B corresponds to the squares. Data after ablation were gathered from comparable time windows after the ablation procedure (10–20 min after ablation). The motion-induced responses (solid lines), averaged over the 2, 3, and 6 Hz temporal frequency conditions, and baseline (dashed lines) response amplitudes before and after ablation, each presented four times. After ablation, the baseline activity increased with an overall factor of 3.9 ± 1.4. The motion-induced response was weakened after ablation in all experiments, although to a different extent. D, For the same experiments, the average baseline activity was subtracted from the corresponding average motion-induced response amplitudes. VS2/3 ablation always led to a compressed response range of V1 for the representation of preferred-direction motion. E, Control experiments. Average spike-frequency histograms obtained from 10 different V1 recordings during constant-velocity motion stimulation before (black line) and after (gray line) laser illumination without previous dye filling of a presynaptic VS cell. Squares and circles indicate corresponding means and SDs of V1 spike activities.
Figure 3.
Figure 3.
A, Mean spike rate (the response trace is plotted with a temporal resolution of 10 Hz) of V1 during dynamic motion stimulation before (black line) and after (dark gray line) ablation of a VS2/3 cell (same V1 cell as in Fig. 2A). The motion-induced spike responses modulate similarly with motion velocity before and after ablation. The gray line shows the velocity profile of a section of the dynamic motion stimulus followed by a time interval, during which the pattern was stationary (same temporal resolution as the spike response traces). Positive values of motion velocity indicate preferred-direction motion, and negative values indicate motion in the null direction. To obtain the spike-frequency histogram, response traces were averaged over four stimulus repetitions. Bottom, Raster plots of the individual responses before (black) and after (gray) ablation to an excerpt of the dynamic motion trace. Each dot indicates the occurrence of a V1 spike. B, Mean coherence values averaged over the control experiments with an extended dataset (gray line; n = 10 presentations of each of the 8 dynamic motion traces; n = 5 experiments) as well as with an additional longer-lasting dynamic motion sequence (black line; n = 25 presentations of the motion trace; n = 8 experiments). C, Impulse responses of the reconstruction filters obtained for the four ablation experiments before (black lines) and after (gray lines) ablation of a VS2/3 cell (experiment shown in A is denoted by the lowercase a). D, Segment of the motion-velocity trace (gray line) and the estimated stimulus as derived from convolving the responses with the reconstruction filters before (black line) and after (dark gray line) ablation. Data are from the experiment in A and in a. E, Mean coherence values averaged over all four ablation experiments together with the corresponding SDs. The comparison between the coherence functions of the V1 cells before (solid line) and after (gray line) reflect a robust representation of motion velocity. Coherence functions were determined to quantify the relationship between the dynamic motion stimuli and corresponding V1 responses. In each experiment, data were gathered from V1 responses to eight dynamic motion traces; each motion trace was presented four times.
Figure 4.
Figure 4.
Impact of VS1 ablation on the response properties of V1 during constant-velocity motion stimulation. Mean spike frequencies before (black line), initially after ablation (dark gray line), and ∼5 min after ablation (gray line). V1 spikes were counted in 100 ms time segments. Initially after ablation, a dramatic increase in baseline activity of V1 was observed, and motion-induced changes in activity were small. Later, the spike activity was reduced below its baseline activity during preferred-direction motion stimulation.
Figure 5.
Figure 5.
Response change of V1 after ablation of a presynaptic VS cell with a lateral maximum sensitivity to downward motion. A, Spike frequency histograms (mean spike frequencies averaged over 4 stimulus repetitions; temporal resolution of 100 ms) before (black line) and after (gray line) ablation. Squares and circles denote means and SDs of motion-induced and baseline activity of V1, respectively. Whereas the motion-induced response components are reduced, the baseline activity remains unchanged after ablation. B, Coherence functions before (black line) and after (gray line) ablation. The corresponding coherence values did not change after ablation of a VS cell with a lateral receptive field.
Figure 6.
Figure 6.
Different wiring schemes for the localization of chemical and/or electrical synapses between presynaptic VS cells and the postsynaptic V1, which might explain the observed ablation-induced changes in baseline and motion-induced activity of V1. Coupling of VS cells by electrical synapses was recently shown by Haag and Borst (2004). A, Chemical synapses between VS cells and V1 with synaptic gain being stronger between VS2/3 and V1 than between the other VS cells and V1. B, In case of electrical synaptic connections within the neural VS–V1 circuit, the coupling strength between VS1 and V1 would have to be strongest to explain the results. C, VS1 forms the only direct coupling with V1 via electrical synapses. D, Electrical connections between VS1 and V1 and chemical synapses between the other presynaptic VS cells and V1 are in good agreement with the experimental findings.

Similar articles

Cited by

References

    1. Alvarez-Leefmans FJ, De Santis A, Miledi R (1979). Effects of some divalent cations on synaptic transmission in frog spinal neurones. J Physiol (Lond) 294:387–406. - PMC - PubMed
    1. Borst A, Haag J (2002). Neural networks in the cockpit of the fly. J Comp Physiol A Neuroethol Sens Neural Behav Physiol 188:419–437. - PubMed
    1. Borst A, Theunissen FE (1999). Information theory and neural coding. Nat Neurosci 2:947–957. - PubMed
    1. Brenner N, Strong SP, Koberle R, Bialek W, de Ruyter van Steveninck RR (2000). Synergy in a neural code. Neural Comput 12:1531–1552. - PubMed
    1. de Ruyter van Steveninck RR, Laughlin SB (1996). The rate of information transfer at graded-potential synapses. Nature 379:642–645.

Publication types

MeSH terms

LinkOut - more resources