. 2006 Jul 26;26(30):7984-94.
doi: 10.1523/JNEUROSCI.2211-06.2006.

Sodium channel beta2 subunits regulate tetrodotoxin-sensitive sodium channels in small dorsal root ganglion neurons and modulate the response to pain

Affiliations

Sodium channel beta2 subunits regulate tetrodotoxin-sensitive sodium channels in small dorsal root ganglion neurons and modulate the response to pain

Luis F Lopez-Santiago et al. J Neurosci. .

Abstract

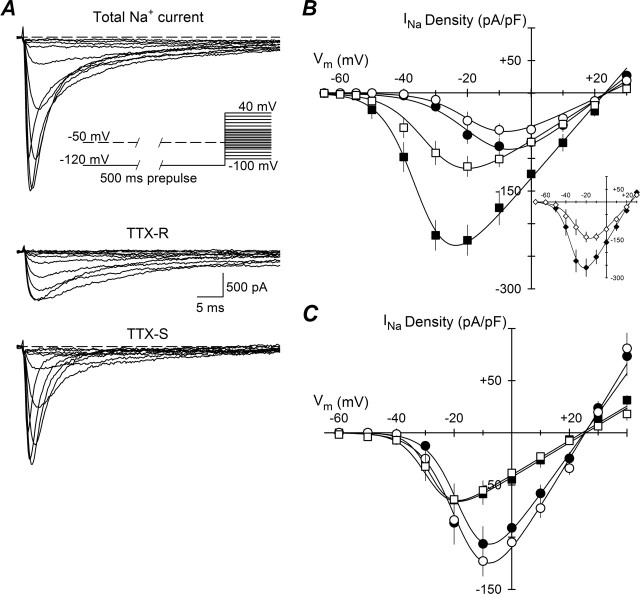
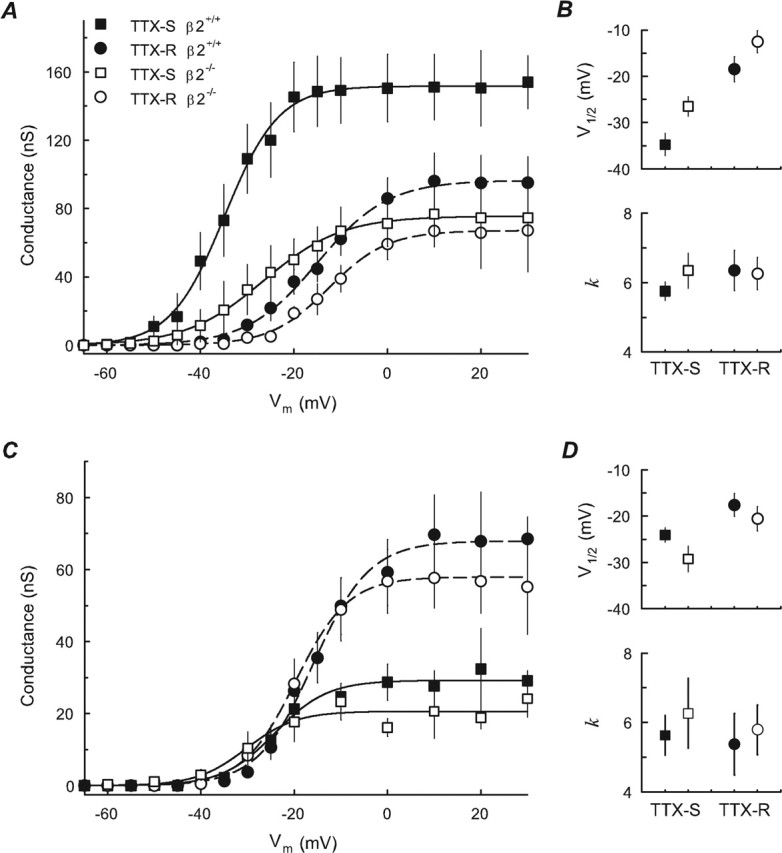
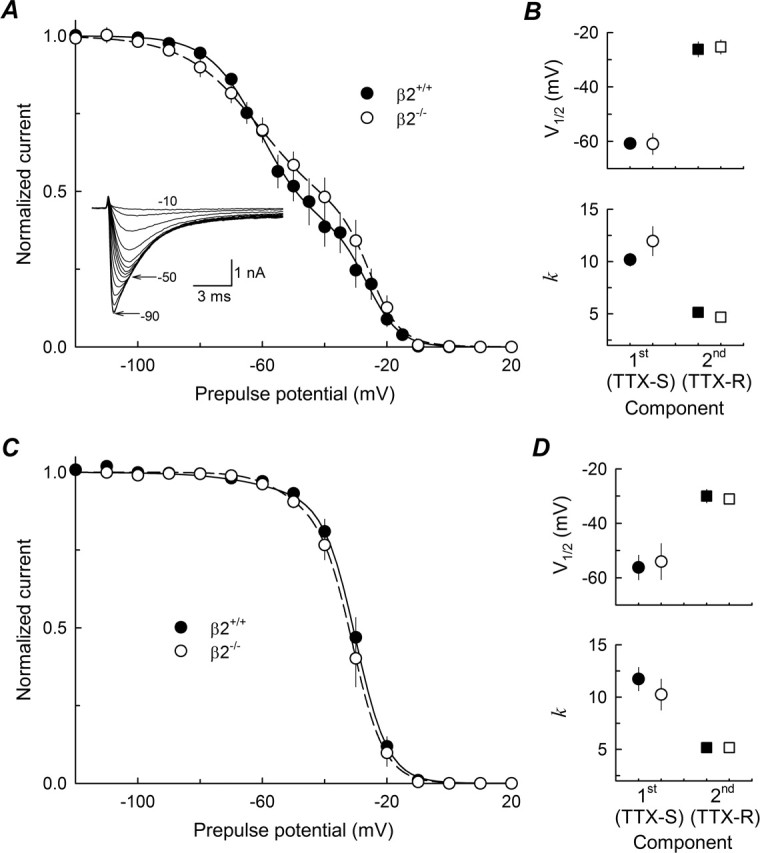
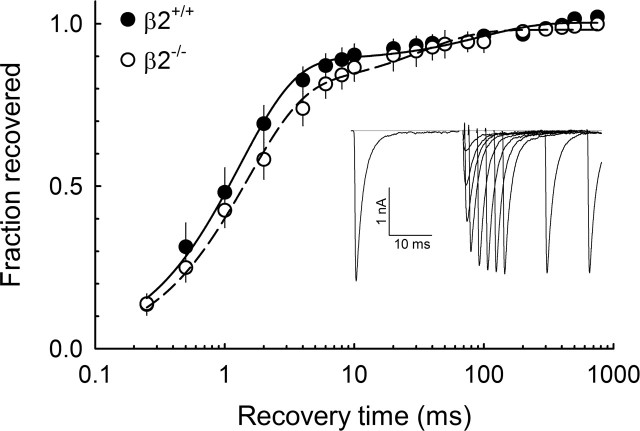
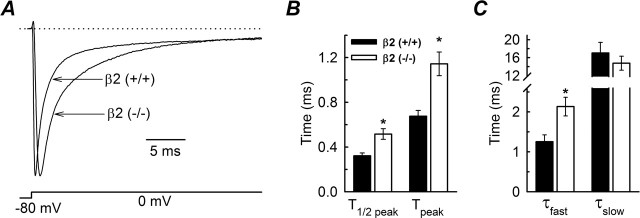
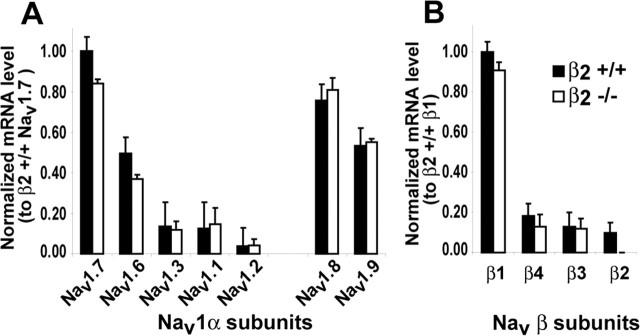
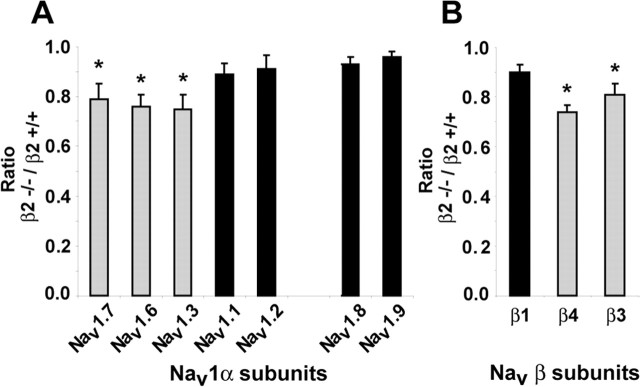
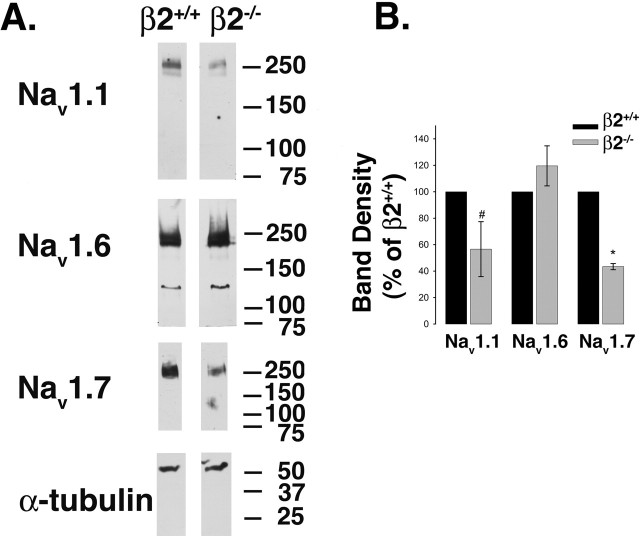
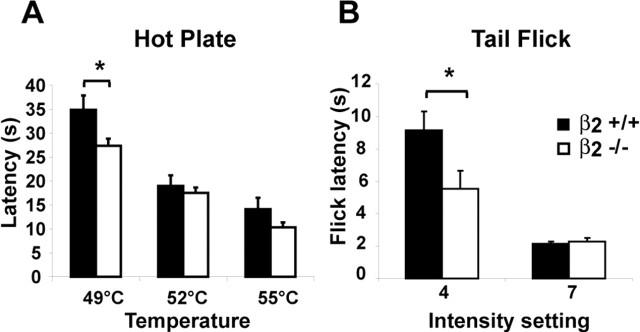
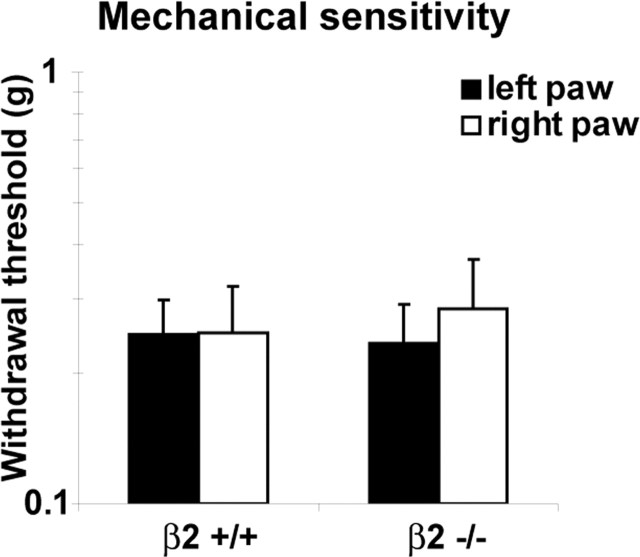
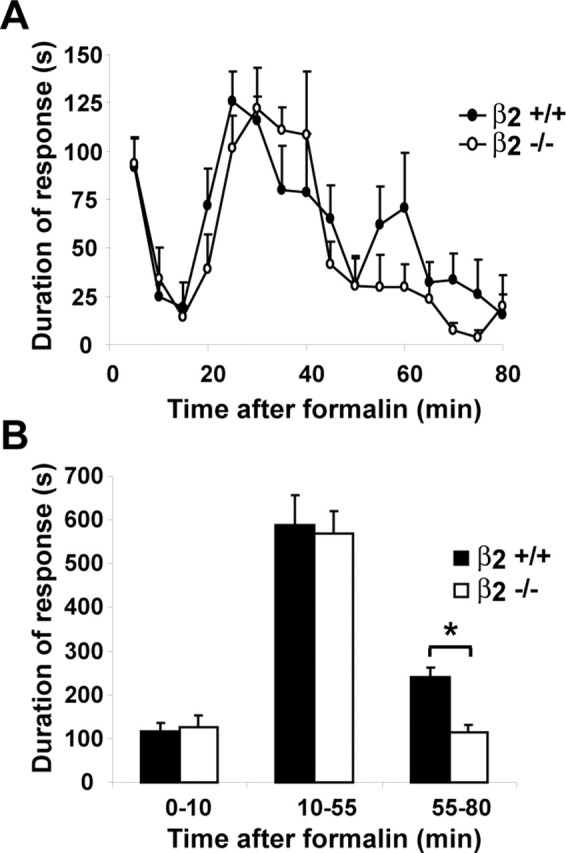
Voltage-gated sodium channel (Na(v)1) beta2 subunits modulate channel gating, assembly, and cell-surface expression in CNS neurons in vitro and in vivo. beta2 expression increases in sensory neurons after nerve injury, and development of mechanical allodynia in the spared nerve injury model is attenuated in beta2-null mice. Thus, we hypothesized that beta2 modulates electrical excitability in dorsal root ganglion (DRG) neurons in vivo. We compared sodium currents (I(Na)) in small DRG neurons from beta2+/+ and beta2-/- mice to determine the effects of beta2 on tetrodotoxin-sensitive (TTX-S) and tetrodotoxin-resistant (TTX-R) Na(v)1 in vivo. Small-fast DRG neurons acutely isolated from beta2-/- mice showed significant decreases in TTX-S I(Na) compared with beta2+/+ neurons. This decrease included a 51% reduction in maximal sodium conductance with no detectable changes in the voltage dependence of activation or inactivation. TTX-S, but not TTX-R, I(Na) activation and inactivation kinetics in these cells were slower in beta2(-/-) mice compared with controls. The selective regulation of TTX-S I(Na) was supported by reductions in transcript and protein levels of TTX-S Na(v)1s, particularly Na(v)1.7. Low-threshold mechanical sensitivity was preserved in beta2-/- mice, but they were more sensitive to noxious thermal stimuli than wild type whereas their response during the late phase of the formalin test was attenuated. Our results suggest that beta2 modulates TTX-S Na(v)1 mRNA and protein expression resulting in increased TTX-S I(Na) and increases the rates of TTX-S Na(v)1 activation and inactivation in small-fast DRG neurons in vivo. TTX-R I(Na) were not significantly modulated by beta2.


Figures

Figure 1.
Figure 1.
Current–voltage relationships. A, Protocol for separation of TTX-R and TTX-S INa. A 500 ms prepulse to −120 or −50 mV was applied before a 50 ms test pulse from −100 to 40 mV with steps of 5 or 10 mV (inset). Currents evoked from one β2−/− small-fast DRG neuron by test pulses from −50 to 0 mV are shown. Both TTX-S and TTX-R INa were apparent after the −120 mV prepulse (top traces); only TTX-R INa were obtained after the −50 mV prepulse (middle traces), and the TTX-S component was obtained (bottom traces) by digitally subtracting the TTX-R INa from the total INa B, Average peak INa density–voltage relationships for TTX-R INa (circles) and TTX-S INa (squares) of small-fast DRG neurons (means ± SEM), β2+/+ (closed symbols; n = 15), or β2−/− (open symbols; n = 14). Smooth lines are I–V curves generated using the Boltzmann fit parameters of the respective activation curves. Inset, I–V curves of total INa from the same cells as in A, β2+/+ (closed symbols) and β2−/− (open symbols). C, Similar to B, but for small-slow neurons, β2+/+ (closed symbols; n = 14), or β2−/− (open symbols; n = 11).
Figure 2.
Figure 2.
Voltage dependence of activation. A, Activation curve of peak sodium conductance: TTX-R (circles) and TTX-S (squares) obtained from the same small-fast cells as in Figure 1B, β2+/+ (closed symbols), and β2−/− (open symbols). Smooth lines are fits to a Boltzmann function for TTX-R (dashed lines) and TTX-S (solid lines) currents, respectively. B, Midpoint potential (V1/2) and slope factor (k) of fitted activation curves of small-fast cells. C, D, Same small-slow cells as in Figure 1C with symbols as in A and B. Error bars indicate SEM.
Figure 3.
Figure 3.
Voltage dependence of inactivation. A, Peak INa at 0 mV, normalized to its maximal value (inset), as a function of voltage during a 500 ms prepulse. INa were measured from β2+/+ (n = 13; closed circles) and β2−/− (n = 10; open circles) small-fast DRG neurons. Each data set was fit with a double Boltzmann function (lines). The inset is an example of INa at 0 mV, from one small-fast β2+/+ cell, after 500 ms prepulses from −90 to −10 mV. B, Parameters of fitted inactivation curves shown in A; circles represent the first component (TTX-S), and squares represent the second component (TTX-R). C, D, Inactivation curves and parameters, respectively, for small-slow β2+/+ (n = 12) and β2−/− (n = 8) neurons; symbols are as in A and B. Error bars indicate SEM.
Figure 4.
Figure 4.
Recovery from inactivation. The average time course of recovery from inactivation for total INa from small-fast neurons β2+/+ (closed symbols; n = 6) and β2−/− (open symbols; n = 5) is shown. The data were fit with a double exponential (lines) with the following results: for β2+/+, τ1 = 1.3 ± 0.2 ms and τ2 = 95.3 ± 17.8 ms; for β2−/−, τ1 = 1.5 ± 0.5 ms and τ2 = 83.3 ± 29.4 ms. Inset, A representative record from one β2+/+ cell shows INa obtained from recovery intervals of 0.25–30 ms to −120 mV. Error bars indicate SEM.
Figure 5.
Figure 5.
Activation and inactivation kinetics of INa at 0 mV. A, Normalized INa evoked by a test pulse to 0 mV from a holding potential of −80 mV. INa are shown from a typical small-fast β2+/+ cell and a typical small-fast β2−/− cell. B, Time to achieve 50 and 100% activation. The data were obtained from small-fast β2+/+ (n = 16) and small-fast β2−/− (n = 18) neurons. C, Time constants of INa inactivation for the same cells as in B. The two time constants of inactivation (τfast and τslow) were obtained by fitting the decay phase of the INa with a double-exponential function. ∗p < 0.05, Significantly different from β2+/+. Error bars indicate SEM.
Figure 6.
Figure 6.
Expression levels of Nav1 mRNAs in DRGs. A, Transcript levels of Nav1 α subunits expressed in β2+/+ (filled bars) and β2−/− (open bars) DRGs; all levels are normalized to Nav1.7 levels measured in β2+/+ DRGs. B, Normalized transcript levels of β subunits to β1 expressed in β2+/+ DRGs. Data are mean ± SEM from a real-time reverse transcription-PCR experiment performed in triplicate using a mix of three samples.
Figure 7.
Figure 7.
Effect of the β2 null mutation on Nav1 mRNA levels. A, Ratio of β2−/−/β2+/+ transcript levels for α subunit mRNAs. B, Ratio of β2−/−/β2+/+ transcript levels for β subunit mRNAs. Black bars, mRNA level does not change; gray bars, mRNA level is reduced. ∗p < 0.05.
Figure 8.
Figure 8.
Reduction in TTX-S Nav1 protein levels in β2 null neurons. A, Equal aliquots of DRG protein homogenates were separated by SDS-PAGE, transferred to nitrocellulose, and probed with specific Nav1 α subunit antibodies as indicated. All blots were subsequently probed with anti-α-tubulin to control for sample loading. The α-tubulin blot corresponding to the Nav1.7 blot is shown as an example. B, Immunoreactive bands were quantified using densitometry. Each band density was first normalized to its corresponding α-tubulin signal, and β2−/− levels for each Nav1 were expressed as a percentage of β2+/+ levels. For Nav1.1 and Nav1.7: #p < 0.1; ∗p < 0.05; n = 3. There was no significant change for Nav1.6 (n = 4). Error bars represent SEM.
Figure 9.
Figure 9.
Noxious heat sensitivity. A, In the hot-plate test at 49°C, the latency response was decreased in β2−/− mice compared with β2+/+ animals (n = 9 in each group; ∗ p < 0.05). At higher temperatures (52 and 55°C), no statistically significant difference was observable. B, Tail-flick test. Values represent the latency response from the heat source. The latency decreased significantly in β2−/− mice compared with β2+/+ (n = 4 in each group; ∗p < 0.01). No differences were observed at higher intensities. Error bars indicate SEM.
Figure 10.
Figure 10.
Basal mechanical sensitivity. Withdrawal mechanical thresholds were similar in β2+/+ and β2−/− animals (n = 9 in each group; p > 0.05). Error bars indicate SEM.
Figure 11.
Figure 11.
Formalin test. A, Time course of the formalin response after intraplantar injection of 10 μl of 5% formalin. B, Cumulative formalin response to the initial phase (0–10 min), early second phase (10–55 min), and late second phase (55–80 min). β2+/+, filled bars or symbols; β2−/−, open bars or symbols. n = 6 per group; ∗p < 0.05. Error bars indicate SEM.

Similar articles

Cited by

References

    1. Abdulla FA, Smith PA (2001). Axotomy- and autotomy-induced changes in Ca2+ and K+ channel currents of rat dorsal root ganglion neurons. J Neurophysiol 85:644–658. - PubMed
    1. Abdulla FA, Smith PA (2002). Changes in Na(+) channel currents of rat dorsal root ganglion neurons following axotomy and axotomy-induced autotomy. J Neurophysiol 88:2518–2529. - PubMed
    1. Akopian AN, Sivilotti L, Wood JN (1996). A tetrodotoxin-resistant voltage-gated sodium channel expressed by sensory neurons. Nature 379:257–262. - PubMed
    1. Akopian AN, Souslova V, England S, Okuse K, Ogata N, Ure J, Smith A, Kerr BJ, McMahon SB, Boyce S, Hill R, Stanfa LC, Dickenson AH, Wood JN (1999). The tetrodotoxin-resistant sodium channel SNS has a specialized function in pain pathways. Nat Neurosci 2:541–548. - PubMed
    1. Armstrong C, Bezanilla F (1977). Inactivation of the sodium channel. II. Gating current experiments. J Gen Physiol 70:567–590. - PMC - PubMed

Publication types

MeSH terms

LinkOut - more resources