. 2006 Jul 26;26(30):8009-16.
doi: 10.1523/JNEUROSCI.5472-05.2006.

Encoding and decoding touch location in the leech CNS

Affiliations

Encoding and decoding touch location in the leech CNS

Eric E Thomson et al. J Neurosci. .

Abstract

Spike times encode stimulus values in many sensory systems, but it is generally unknown whether such temporal variations are decoded (i.e., whether they influence downstream networks that control behavior). In the present study, we directly address this decoding problem by quantifying both sensory encoding and decoding in the leech. By mechanically stimulating the leech body wall while recording from mechanoreceptors, we show that pairs of leech sensory neurons with overlapping receptive fields encode touch location by their relative latencies, number of spikes, and instantaneous firing rates, with relative latency being the most accurate indicator of touch location. We then show that the relative latency and count are decoded by manipulating these variables in sensory neuron pairs while simultaneously monitoring the resulting behavior. Although both variables are important determinants of leech behavior, the decoding mechanisms are more sensitive to changes in relative spike count than changes in relative latency.


Figures

Figure 1.
Figure 1.
Background and methods for the encoding experiments. A, Left, Illustration of a leech. The leech is a segmented worm with dorsoventral (top to bottom) and anteroposterior axes (front to back, also known as the longitudinal axis). Right, Illustration of a cross section of a leech showing the circumferential axis of its body wall. The ventral midline of the leech (V) is taken to be the origin (θ = 0°). B, Receptive fields show spike count in the four P cells versus touch location θ along the circumferential axis (adapted from Lewis and Kristan, 1998c). The spike counts are normalized to the maximum firing rate for each neuron (V, ventral; D, dorsal; L, left; R, right). The black bar shows the region where we stimulated the leech. C, Schematic of the local bend network (see Results for description). D, In the encoding experiments, we delivered a force step (top) to the leech body wall (middle) while recording voltages from the two ventral P cells (bottom). The extent of the receptive fields of the cells is indicated by ovals on the body wall, and the horizontal lines represent annulus borders (each segment of the leech is made up of five raised ridges known as annuli). The black bars on the time axis of the voltage traces indicate the time course of the force step.
Figure 2.
Figure 2.
Results of encoding experiments. A, Representative neural responses when the body wall is touched 12° to the left of the ventral midline (A1), at the ventral midline (A2), and 12 degrees to the right of the ventral midline (A3). The top panels are responses in the left P cell, and the bottom panels are from the right P cell. B–D, Scatter plots of response latency, spike count, and initial firing rate versus touch location for the right P cell from a single experiment (n = 60 trials). Lines are the best linear fits. In these and the following panels, r is the correlation coefficient and p is the p value when the null hypothesis is that the variables are not correlated (ANOVA). E–G, Scatter plots of latency difference (latency in left P cell minus latency in right P cell), count difference (count in left P cell minus count in right P cell), and initial firing rate difference (initial firing rate in left P cell minus initial firing rate in right P cell) versus touch location. Data are from the same experiment as in the previous panels. H, Percent correct as a function of touch location difference (filled circles with error bars representing mean ± SEM, with the averages defined over all experiments). Red, Latency difference; blue, count difference; green, initial firing rate difference; yellow, latency difference and initial firing rate difference combined; black dashed line, behavior. The lines are the corresponding neurometric functions (see Results, Encoding experiments). The filled squares at the bottom indicate the touch location difference at which the classifier reached 75% correct (4° for latency difference and latency difference combined with initial firing rate difference, 13° for count difference as well as initial firing rate difference, and 9° for behavior).
Figure 3.
Figure 3.
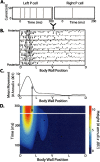
Methods used in the decoding experiments. A, We delivered brief (10 ms) current pulses to the left and right ventral P cells such that each pulse generated one action potential. In the example shown, six spikes were evoked in the left P cell beginning at t = 0 ms and a single spike was evoked in the right P cell at t = 75 ms. B, An optic flow field, which represents the movement (at each pixel) between two consecutive images of the body wall. This example shows the flow field between images captured at 270 and 280 ms after onset of P cell stimulation. Note the movement is clearly centered to the left of the ventral midline. Horizontal gray lines represent annulus borders. C, The bend profile, which is the mean body wall movement in the longitudinal direction (the Y direction) calculated from the flow field in B. D, A complete representation of the longitudinal component of the local bend response on a single trial: the set of bend profiles at 10 ms intervals from 0 to 300 ms after stimulation of the P cells. The white horizontal line indicates the time slice shown in C.
Figure 4.
Figure 4.
Results of the decoding experiments. A, Behavioral responses when the count difference was changed by four spikes with the latency difference held fixed. In A1, five spikes were generated in the left P cell and three in the right (count difference, 2). In A2, the converse holds: three spikes were generated in the left P cell and five in the right (count difference, −2). B, Percent correct as a function of count difference change. Filled circles are mean ± SEM and the line is the best exponential fit (see Results). C, Behavioral responses when the latency difference was changed by 24 ms at a constant count difference. In C1, the left P cell began firing 12 ms before the right (latency difference, −12 ms), and in C2 the left P cell began firing 12 ms after the right (latency difference, +12 ms). In both C1 and C2, both P cells fired five spikes with the same instantaneous firing rates. D, Percent correct as a function of latency difference change. Filled circles are mean ± SEM and the line is the best exponential fit (see Results).
Figure 5.
Figure 5.
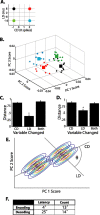
Results of decoding experiments in which we varied both latency difference and count difference. A, Illustration of the four classes of spike trains elicited in the P cells in one set of experiments. CD, Count difference; LD, latency difference. The first and second rows represent trials in which the latency difference was +8 ms and −16 ms, respectively. The first and second columns represent trials in which the count difference was −1 spikes and +2 spikes, respectively. Hence, we generated count difference changes of three spikes (between columns), latency difference changes of 24 ms (between rows), as well as both changes (diagonals). B, Results of one experiment in which we delivered the four stimuli represented in A. The axes are PC scores and each point represents the bend response on a single trial. We use the same color code as in A. The mean response to each stimulus is indicated by a large filled square. C, Bar graph of the distance between mean behavioral responses when the different neuronal variables were changed (mean ± SEM). Each distance within an experiment was normalized to the maximum distance between means for that experiment. “CD” is the case in which count difference was changed by three spikes, “LD” is the case in which latency difference was changed by 24 ms, and “Both” indicates the case in which both variables changed. The asterisk indicates that the distance between the mean behavioral response to the latency difference change was significantly less than the distance when either count difference alone, or both variables, were changed (p < 0.001, t test; n = 6). D, Same as in C, except the count difference change was 1 spike and the latency difference change was 10 ms (p < 0.05, t test; n = 11). E, Summary of how the behavioral response (in PC-score space) is affected by changes in count difference and latency difference. The distribution of responses at a fixed count and latency difference are represented by contour plots of Gaussian distributions (the Gaussian was arbitrarily chosen for illustrative purposes). Within the set of responses at a particular count difference, there is a small graded change in the mean response as latency difference is changed (along axis LD). When the count difference is changed, there is a marked jump in the mean response (along axis CD). θ represents the angle between the CD and LD axes (for discussion, see Results). F, Table comparing the performance of latency difference and count difference (columns) in the encoding and decoding experiments (rows). For the encoding row, the threshold touch location change required to achieve threshold discrimination (75% correct) is shown. The decoding row shows the change in the neuronal variable required to achieve threshold behavioral discrimination of that variable in the decoding experiments (after conversion to the distance between stimuli that would evoke such changes in the neuronal variable; see Results).

Similar articles

Cited by

References

    1. Amassian VE (1953). Evoked single cortical unit activity in the somatic sensory areas. Electroencephalogr Clin Neurophysiol Suppl 5:415–438. - PubMed
    1. Baca SM, Thomson EE, Kristan WB (2005). Location and intensity discrimination in the leech local bend response quantified using optic flow and principal components analysis. J Neurophysiol 93:3560–3572. - PubMed
    1. Britten K, Shadlen MN, Newsome WT, Movshon JA (1992). The analysis of visual motion: a comparison of neuronal and psychophysical performance. J Neurosci 12:4745–4767. - PMC - PubMed
    1. Cholewiak RW (1999). The perception of tactile distance: influences of body site, space, and time. Perception 28:851–875. - PubMed
    1. Duda RO, Hart PE, Stork DG (2000). In: Pattern classification New York: Wiley-Interscience.

Publication types

MeSH terms

LinkOut - more resources