

Spatiotemporal patterns of an evoked network oscillation in neocortical slices: coupled local oscillators
- PMID: 16870836
- PMCID: PMC4415382
- DOI: 10.1152/jn.00645.2006
Spatiotemporal patterns of an evoked network oscillation in neocortical slices: coupled local oscillators
Abstract
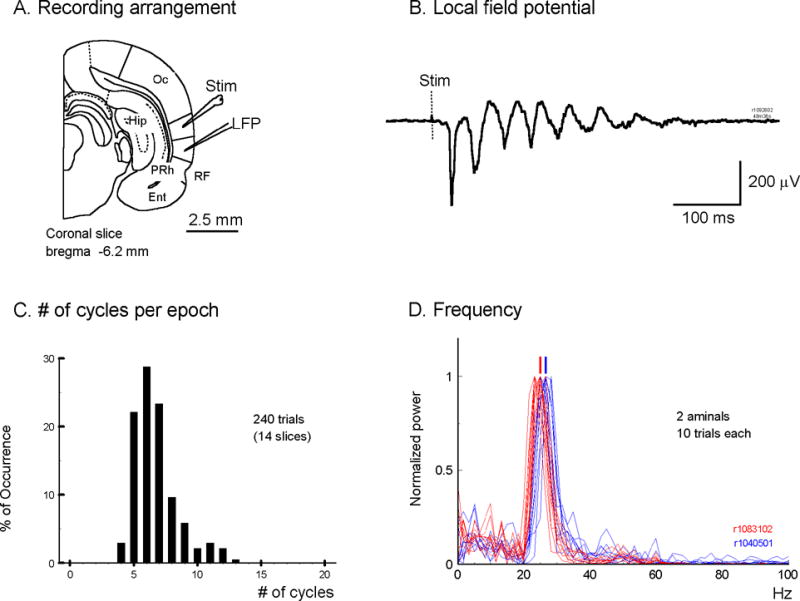
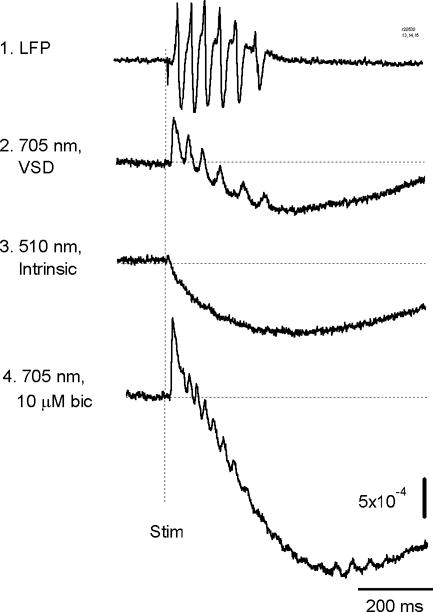
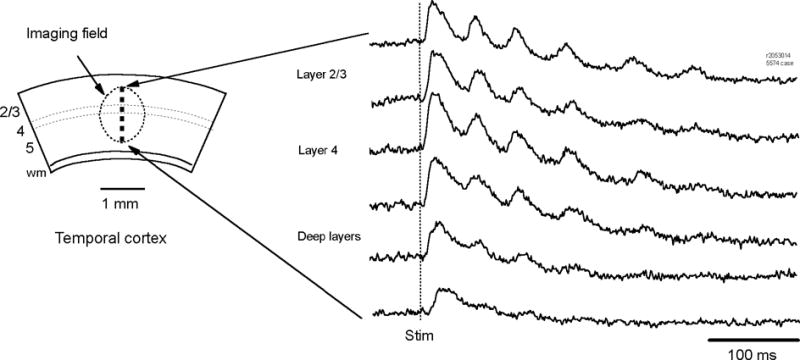
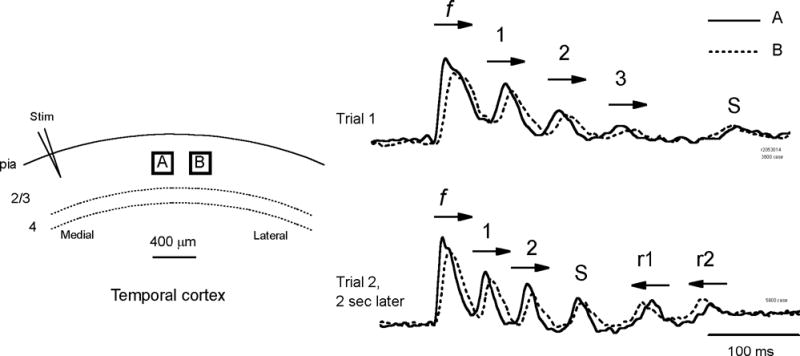
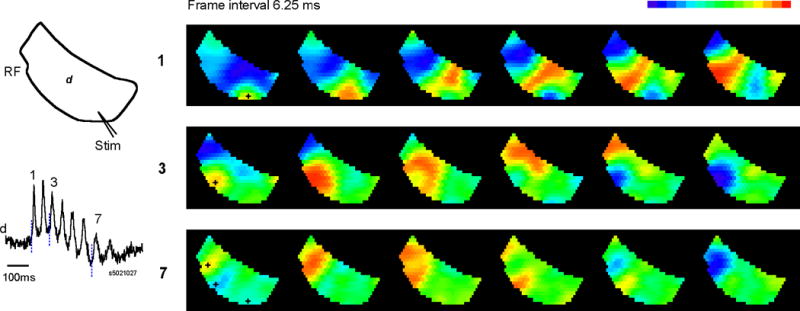
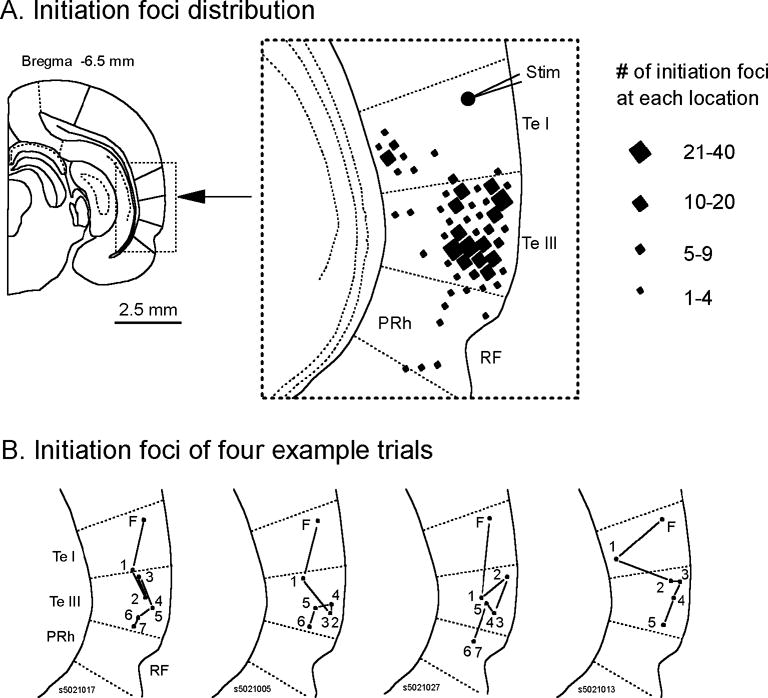
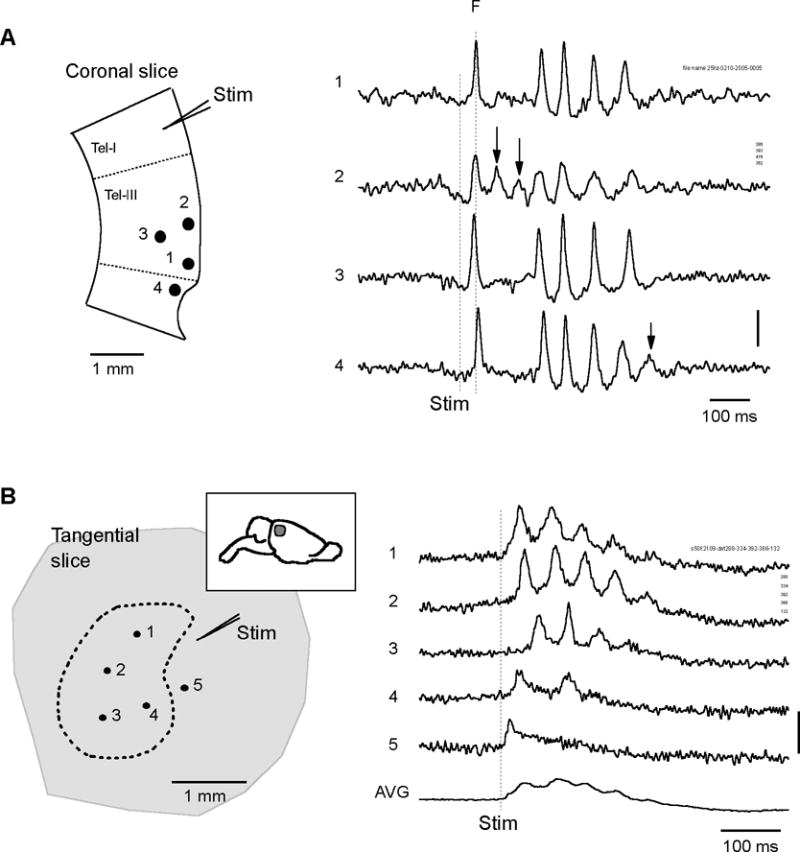
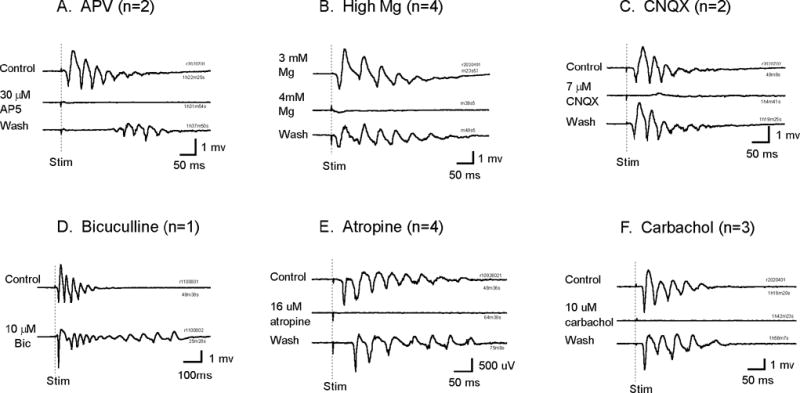
We have discovered an evoked network oscillation in rat neocortical slices and have examined its spatiotemporal patterns with voltage-sensitive dye imaging. The slices (visual and auditory cortices) were prepared in a medium of low calcium, high magnesium and with sodium replaced by choline to reduce the excito-toxicity and sodium loading. After slicing, the choline was washed out while normal calcium, magnesium, and sodium concentrations were restored. The oscillation was evoked by a single electrical shock to slices bathed in normal artificial cerebral spinal fluid (ACSF). The oscillation was organized as an all-or-none epoch containing 4-13 cycles at a central frequency approximately 25 Hz. The activity can be reversibly blocked by 6-cyano-7-nitroquinoxalene-2,3-dione (CNQX). 2-amino-5-phosphonopentanoic acid (APV), and atropine but not by bicuculline, indicating polysynaptic excitatory mechanisms. Voltage-sensitive dye imaging showed high-amplitude oscillation signals in superficial and middle cortical layers. Spatiotemporally, the oscillations were organized as waves, propagating horizontally along cortical laminar. Each oscillation cycle was associated with one wave propagating in space. The waveforms were often different at different locations (e.g., extra cycles), suggesting the co-existence of multiple local oscillators. For different cycles, the waves often initiated at different locations, suggesting that local oscillators are competing to initiate each oscillation cycle. Overall our results suggest that this cortical network oscillation is organized at two levels: locally, oscillating neurons are tightly coupled to form local oscillators, and globally the coupling between local oscillators is weak, allowing abrupt spatial phase lags and propagating waves with multiple initiation sites.
Figures
Similar articles
-
Propagating waves of activity in the neocortex: what they are, what they do.Neuroscientist. 2008 Oct;14(5):487-502. doi: 10.1177/1073858408317066. Neuroscientist. 2008. PMID: 18997124 Free PMC article. Review.
-
Propagating wave and irregular dynamics: spatiotemporal patterns of cholinergic theta oscillations in neocortex in vitro.J Neurophysiol. 2003 Jul;90(1):333-41. doi: 10.1152/jn.00715.2002. Epub 2003 Feb 26. J Neurophysiol. 2003. PMID: 12612003 Free PMC article.
-
Spatiotemporal properties of an evoked population activity in rat sensory cortical slices.J Neurophysiol. 2001 Nov;86(5):2461-74. doi: 10.1152/jn.2001.86.5.2461. J Neurophysiol. 2001. PMID: 11698535
-
Propagating activation during oscillations and evoked responses in neocortical slices.J Neurosci. 1999 Jun 15;19(12):5005-15. doi: 10.1523/JNEUROSCI.19-12-05005.1999. J Neurosci. 1999. PMID: 10366633 Free PMC article.
-
N-methyl-D-aspartate receptors at parallel fiber synapses in the dorsal cochlear nucleus.J Neurophysiol. 1996 Sep;76(3):1639-56. doi: 10.1152/jn.1996.76.3.1639. J Neurophysiol. 1996. PMID: 8890282
Cited by
-
The role of inhibition in oscillatory wave dynamics in the cortex.Eur J Neurosci. 2012 Jul;36(2):2201-12. doi: 10.1111/j.1460-9568.2012.08132.x. Eur J Neurosci. 2012. PMID: 22805065 Free PMC article.
-
Impact of bounded noise on the formation and instability of spiral wave in a 2D Lattice of neurons.Sci Rep. 2017 Feb 21;7:43151. doi: 10.1038/srep43151. Sci Rep. 2017. PMID: 28220877 Free PMC article.
-
Propagating waves of activity in the neocortex: what they are, what they do.Neuroscientist. 2008 Oct;14(5):487-502. doi: 10.1177/1073858408317066. Neuroscientist. 2008. PMID: 18997124 Free PMC article. Review.
-
GABAA receptor-mediated modulation of neuronal activity propagation upon tetanic stimulation in rat hippocampal slices.Pflugers Arch. 2010 Oct;460(5):875-89. doi: 10.1007/s00424-010-0870-9. Epub 2010 Aug 24. Pflugers Arch. 2010. PMID: 20734201
-
Microsaccade-rhythmic modulation of neural synchronization and coding within and across cortical areas V1 and V2.PLoS Biol. 2018 May 31;16(5):e2004132. doi: 10.1371/journal.pbio.2004132. eCollection 2018 May. PLoS Biol. 2018. PMID: 29851960 Free PMC article.
References
-
- Albowitz B, Kuhnt U. Epileptiform activity in the guinea-pig neocortical slice spreads preferentially along supragranular layers–recordings with voltage-sensitive dyes. Eur J Neurosci. 1995;7:1273–1284. - PubMed
-
- Anderson WW, Lewis DV, Swartzwelder HS, Wilson WA. Magnesium-free medium activates seizure-like events in the rat hippocampal slice. Brain Res. 1986;398:215–219. - PubMed
-
- Arieli A, Shoham D, Hildesheim R, Grinvald A. Coherent spatiotemporal patterns of ongoing activity revealed by real-time optical imaging coupled with single-unit recording in the cat visual cortex. J Neurophysiol. 1995;73:2072–2093. - PubMed
-
- Arieli A, Sterkin A, Grinvald A, Aertsen A. Dynamics of ongoing activity: explanation of the large variability in evoked cortical responses. Science. 1996;273:1868–1871. - PubMed
Publication types
MeSH terms
Substances
Grants and funding
LinkOut - more resources
Full Text Sources