Comparative Study
. 2006 Jul 26:7:359.
doi: 10.1186/1471-2105-7-359.

Comparison and evaluation of methods for generating differentially expressed gene lists from microarray data

Affiliations
Comparative Study

Comparison and evaluation of methods for generating differentially expressed gene lists from microarray data

Ian B Jeffery et al. BMC Bioinformatics. .

Abstract

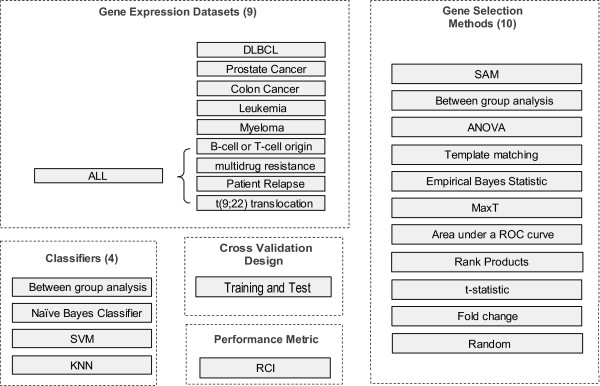
Background: Numerous feature selection methods have been applied to the identification of differentially expressed genes in microarray data. These include simple fold change, classical t-statistic and moderated t-statistics. Even though these methods return gene lists that are often dissimilar, few direct comparisons of these exist. We present an empirical study in which we compare some of the most commonly used feature selection methods. We apply these to 9 publicly available datasets, and compare, both the gene lists produced and how these perform in class prediction of test datasets.

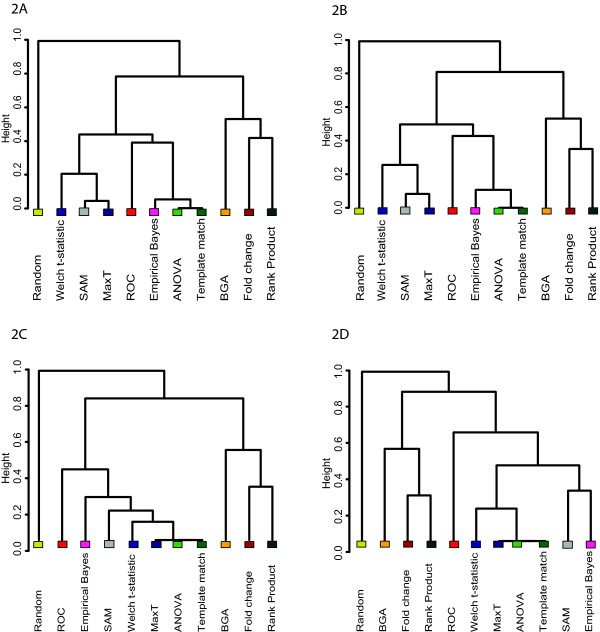
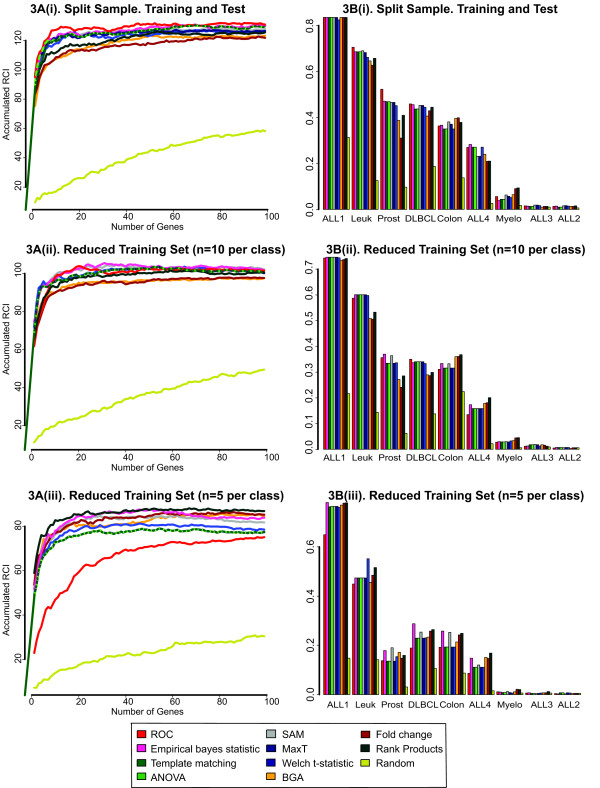
Results: In this study, we compared the efficiency of the feature selection methods; significance analysis of microarrays (SAM), analysis of variance (ANOVA), empirical bayes t-statistic, template matching, maxT, between group analysis (BGA), Area under the receiver operating characteristic (ROC) curve, the Welch t-statistic, fold change, rank products, and sets of randomly selected genes. In each case these methods were applied to 9 different binary (two class) microarray datasets. Firstly we found little agreement in gene lists produced by the different methods. Only 8 to 21% of genes were in common across all 10 feature selection methods. Secondly, we evaluated the class prediction efficiency of each gene list in training and test cross-validation using four supervised classifiers.

Conclusion: We report that the choice of feature selection method, the number of genes in the genelist, the number of cases (samples) and the noise in the dataset, substantially influence classification success. Recommendations are made for choice of feature selection. Area under a ROC curve performed well with datasets that had low levels of noise and large sample size. Rank products performs well when datasets had low numbers of samples or high levels of noise. The Empirical bayes t-statistic performed well across a range of sample sizes.


Figures

Figure 1
Figure 1
Experimental design used to study the classifier power of genes lists from different feature selection methods. The most highly ranked genes were selected from 9 gene expression datasets using 11 feature selection approaches (10 methods and random). The power of these gene lists (of length between 2 and 100 genes) to form classifiers was assessed using four supervised classification methods. In each case genes were selected and classifiers trained using a training dataset. They were tested using training and test cross validation. The cumulative relative classifier information (RCI) score was recorded for each classification.
Figure 2
Figure 2
Overlap in gene lists produced by different feature selection methods. Each feature selection method was applied to datasets containing A) all samples, B) 50% samples, C) 10 samples per class, or D) 5 samples per class. The overlap of genes ranked in the top 100 by each method was compared using a binary distance metric. Dendrograms show the results of average linkage hierarchical cluster analysis of these scores which were accumulated over all 9 datasets.
Figure 3
Figure 3
Gene lists are input to classifiers: training and test cross validation. Each feature selection method was applied to training datasets that contained i) 50% of samples, ii) 20 samples (10 from each class) or iii) 10 samples (5 from each class), and the most highly ranked genes were selected to generate gene lists of length between 2 and 100 genes. The ability of these gene lists to form successful classifiers was evaluated. The graphs (A) show the prediction success (cumulative RCI values) of these when applied to all 9 datasets and evaluated using four classification tools. Note that the scale of Y-axis (cumulative RCI value) is different between plots. The bar plots (B) show average RCI values showing the success of the top 40 genes, selected by 10 feature selection methods, to form classifiers which can predict the class of blind test data for each of the 9 datasets.

References

    1. Margalit O, Somech R, Amariglio N, Rechavi G. Microarray-based gene expression profiling of hematologic malignancies: basic concepts and clinical applications. Blood Rev. 2005;19:223–234. doi: 10.1016/j.blre.2004.11.003. - DOI - PubMed
    1. Pan W. A comparative review of statistical methods for discovering differentially expressed genes in replicated microarray experiments. Bioinformatics. 2002;18:546–554. doi: 10.1093/bioinformatics/18.4.546. - DOI - PubMed
    1. Tusher VG, Tibshirani R, Chu G. Significance analysis of microarrays applied to the ionizing radiation response. Proc Natl Acad Sci USA. 2001;98:5116–5121. doi: 10.1073/pnas.091062498. - DOI - PMC - PubMed
    1. Mutch DM, Berger A, Mansourian R, Rytz A, Roberts MA. The limit fold change model: a practical approach for selecting differentially expressed genes from microarray data. BMC Bioinformatics. 2002;3:17. doi: 10.1186/1471-2105-3-17. - DOI - PMC - PubMed
    1. Long AD, Mangalam HJ, Chan BY, Tolleri L, Hatfield GW, Baldi P. Improved statistical inference from DNA microarray data using analysis of variance and a Bayesian statistical framework. Analysis of global gene expression in Escherichia coli K12. J Biol Chem. 2001;276:19937–19944. doi: 10.1074/jbc.M010192200. - DOI - PubMed

Publication types

LinkOut - more resources