Comparative Study
. 2006 Jul 26:7:189.
doi: 10.1186/1471-2164-7-189.

Conservation of alternative polyadenylation patterns in mammalian genes

Affiliations
Comparative Study

Conservation of alternative polyadenylation patterns in mammalian genes

Takeshi Ara et al. BMC Genomics. .

Abstract

Background: Alternative polyadenylation is a widespread mechanism contributing to transcript diversity in eukaryotes. Over half of mammalian genes are alternatively polyadenylated. Our understanding of poly(A) site evolution is limited by the lack of a reliable identification of conserved, equivalent poly(A) sites among species. We introduce here a working definition of conserved poly(A) sites as sites that are both (i) properly aligned in human and mouse orthologous 3' untranslated regions (UTRs) and (ii) supported by EST or cDNA data in both species.

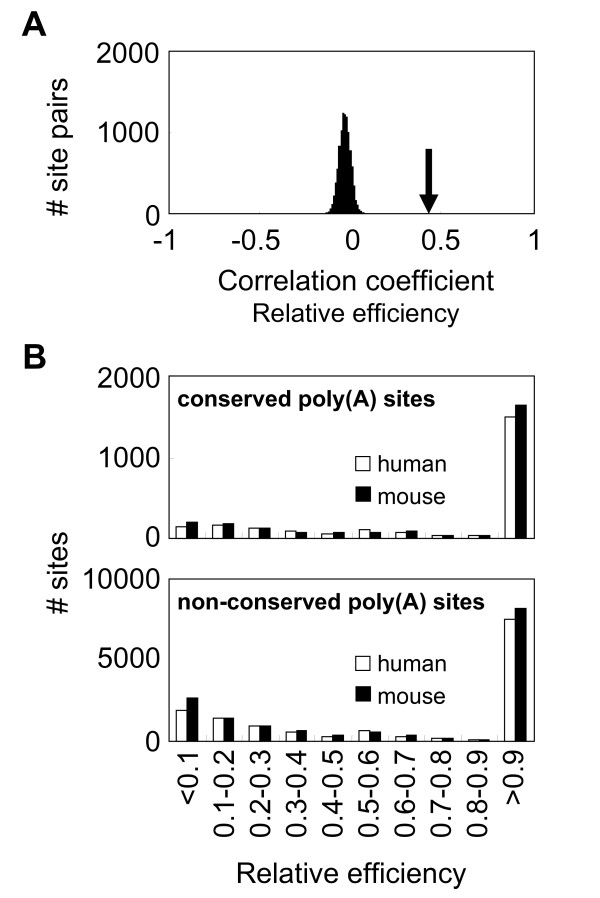
Results: We identified about 4800 such conserved poly(A) sites covering one third of the orthologous gene set studied. Characteristics of conserved poly(A) sites such as processing efficiency and tissue-specificity were analyzed. Conserved sites show a higher processing efficiency but no difference in tissular distribution when compared to non-conserved sites. In general, alternative poly(A) sites are species-specific and involve minor, non-conserved sites that are unlikely to play essential roles. However, there are about 500 genes with conserved tandem poly(A) sites. A significant fraction of these conserved tandems display a conserved arrangement of major/minor sites in their 3' UTR, suggesting that these alternative 3' ends may be under selection.

Conclusion: This analysis allows us to identify potential functional alternative poly(A) sites and provides clues on the selective mechanisms at play in the appearance of multiple poly(A) sites and their maintenance in the 3' UTRs of genes.


Figures

Figure 1
Figure 1
Definition of conserved and non-conserved polyadenylation sites. Cleavage sites are shown by flags and polyadenylation signals are shown by black squares. (A) sites are within 30 bp of each other and aligned associated signals: conserved; (B) sites are within 30 bp of each other, however, their associated signals are not aligned: non conserved; (C) although the sites themselves are aligned, their signals are not: non conserved.
Figure 2
Figure 2
Proportion of conserved sites among single sites and among tandem sites, in human and mouse.
Figure 3
Figure 3
Distribution of ortholog gene pairs against polyadenylation site numbers in human and mouse genes. Table cells provide numbers of orthologous gene pairs in function of the number of polyadenylation sites in human genes (rows) and in mouse genes (columns). Expected values, based on the null hypothesis that there is no correlation, are shown in parentheses. Correlation P value: 6.2 × 10-260 2 test).
Figure 4
Figure 4
Distribution of polyadenylation sites in proximal or distal parts of 3'UTRs. Numbers of conserved sites ("Cons", white) and non-conserved sites ("Non-cons", black) located in proximal or distal parts of 3'UTR regions are shown for human (A) and mouse (B).
Figure 5
Figure 5
Relative efficiency of conserved and non-conserved polyadenylation sites. (A) Distribution of 10,000 control correlation coefficients each computed from 1000 random pairs of non-conserved sites from orthologous human and mouse genes. Arrow indicates the correlation coefficient observed for pairs of conserved sites (r = 0.45). (B) Distribution of relative efficiency of conserved and non-conserved polyadenylation sites. Number of sites in human (white) and mouse (black) is plotted against relative efficiency.
Figure 6
Figure 6
Rat conservation of mouse non-conserved sites. Left: ratio of mouse polyadenylation sites that are non-conserved in the human genome and are conserved in rat. Right: ratio of mouse polyadenylation sites that are non-conserved in the human genome and are non-conserved in rat. Ratios are given for minor (RE<0.5) and major (RE>0.5) sites.
Figure 7
Figure 7
Relative tissue-specificity of conserved and non-conserved polyadenylation sites. (A) Distribution of 10,000 control correlation coefficients each computed from 1000 random pairs of non-conserved sites from orthologous human and mouse genes. Arrow indicates the correlation coefficient observed for pairs of conserved sites (r = 0.10). (B) Distribution of relative tissue-specificities in conserved and non-conserved polyadenylation sites. Number of sites in human (white) and mouse (black) is plotted against relative tissue specificity.
Figure 8
Figure 8
Spatial efficiency/specificity patterns and conservation. (A) Definition of spatial efficiency/specificity patterns. Ortholog gene pairs with identical numbers of conserved polyadenylation sites are considered. A conserved pattern is defined as a series of sites between two orthologous genes, where each site bares the same properties (major/minor or broad/narrow) as its orthologous counterpart (e.g. gene X). All other patterns are defined as non-conserved (e.g. gene Y). (B) Relationship between tandem poly(A) site spatial patterns and conservation. The first row shows different patterns in which one major site is conserved. The second row shows different patterns in which two sites are conserved. Numbers of human genes ("h") and mouse genes ("m") displaying each pattern are shown. Circled numbers indicate ratio of patterns in second row over patterns in first row.
Figure 9
Figure 9
Distribution of differentially-processed polyadenylation sites. (A) Ratio of differentially-processed sites (P < 0.05, Fisher's exact test with Bonferroni correction) against total sites, for human (white) and mouse (black) genes, shown for major and minor sites. (B) Ratio of differentially-processed sites (P < 0.05, Fisher's exact test with Bonferroni correction) against total sites, shown for conserved and non-conserved sites. Value above each bar show absolute numbers of differentially-processed sites.
Figure 10
Figure 10
Tissue-distribution of differentially-processed, polyadenylation sites, in human (white) and mouse (black).

References

    1. Edwalds-Gilbert G, Veraldi KL, Milcarek C. Alternative poly(A) site selection in complex transcription units: means to an end? Nucleic Acids Res. 1997;25:2547–2561. doi: 10.1093/nar/25.13.2547. - DOI - PMC - PubMed
    1. Beaudoing E, Freier S, Wyatt J, Claverie JM, Gautheret D. Patterns of variant polyadenylation signals in human genes. Genome Res. 2000;10:1001–1010. doi: 10.1101/gr.10.7.1001. - DOI - PMC - PubMed
    1. Zhang H, Hu J, Recce M, Tian B. PolyA_DB: a database for mammalian mRNA polyadenylation. Nucleic Acids Res. 2005;33:D116–D120. doi: 10.1093/nar/gki055. - DOI - PMC - PubMed
    1. Tian B, Hu J, Zhang H, Lutz CS. A large-scale analysis of mRNA polyadenylation of human and mouse genes. Nucleic Acids Res. 2005;33:201–212. doi: 10.1093/nar/gki158. - DOI - PMC - PubMed
    1. Yan J, Marr TG. Computational analysis of 3'-ends of ESTs shows four classes of alternative polyadenylation in human, mouse, and rat. Genome Res. 2005;15:369–375. doi: 10.1101/gr.3109605. - DOI - PMC - PubMed

Publication types