

Improving the quality of protein structure models by selecting from alignment alternatives
- PMID: 16872519
- PMCID: PMC1579234
- DOI: 10.1186/1471-2105-7-364
Improving the quality of protein structure models by selecting from alignment alternatives
Abstract
Background: In the area of protein structure prediction, recently a lot of effort has gone into the development of Model Quality Assessment Programs (MQAPs). MQAPs distinguish high quality protein structure models from inferior models. Here, we propose a new method to use an MQAP to improve the quality of models. With a given target sequence and template structure, we construct a number of different alignments and corresponding models for the sequence. The quality of these models is scored with an MQAP and used to choose the most promising model. An SVM-based selection scheme is suggested for combining MQAP partial potentials, in order to optimize for improved model selection.
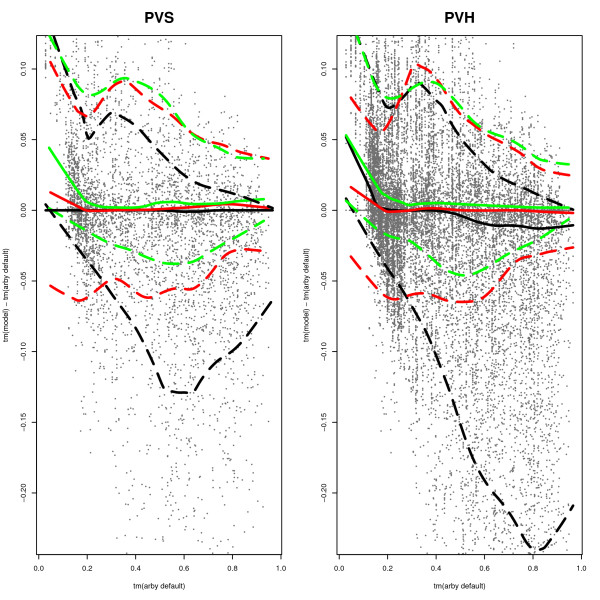
Results: The approach has been tested on a representative set of proteins. The ability of the method to improve models was validated by comparing the MQAP-selected structures to the native structures with the model quality evaluation program TM-score. Using the SVM-based model selection, a significant increase in model quality is obtained (as shown with a Wilcoxon signed rank test yielding p-values below 10(-15)). The average increase in TMscore is 0.016, the maximum observed increase in TM-score is 0.29.
Conclusion: In template-based protein structure prediction alignment is known to be a bottleneck limiting the overall model quality. Here we show that a combination of systematic alignment variation and modern model scoring functions can significantly improve the quality of alignment-based models.
Figures
Similar articles
-
Benchmarking consensus model quality assessment for protein fold recognition.BMC Bioinformatics. 2007 Sep 18;8:345. doi: 10.1186/1471-2105-8-345. BMC Bioinformatics. 2007. PMID: 17877795 Free PMC article.
-
Improving sequence-based fold recognition by using 3D model quality assessment.Bioinformatics. 2005 Sep 1;21(17):3509-15. doi: 10.1093/bioinformatics/bti540. Epub 2005 Jun 14. Bioinformatics. 2005. PMID: 15955780
-
Fold recognition by predicted alignment accuracy.IEEE/ACM Trans Comput Biol Bioinform. 2005 Apr-Jun;2(2):157-65. doi: 10.1109/TCBB.2005.24. IEEE/ACM Trans Comput Biol Bioinform. 2005. PMID: 17044180
-
Fr-TM-align: a new protein structural alignment method based on fragment alignments and the TM-score.BMC Bioinformatics. 2008 Dec 12;9:531. doi: 10.1186/1471-2105-9-531. BMC Bioinformatics. 2008. PMID: 19077267 Free PMC article.
-
Quality assessment of protein structure models.Curr Protein Pept Sci. 2009 Jun;10(3):216-28. doi: 10.2174/138920309788452173. Curr Protein Pept Sci. 2009. PMID: 19519452 Review.
Cited by
-
Effect of using suboptimal alignments in template-based protein structure prediction.Proteins. 2011 Jan;79(1):315-34. doi: 10.1002/prot.22885. Proteins. 2011. PMID: 21058297 Free PMC article.
-
QMEANclust: estimation of protein model quality by combining a composite scoring function with structural density information.BMC Struct Biol. 2009 May 20;9:35. doi: 10.1186/1472-6807-9-35. BMC Struct Biol. 2009. PMID: 19457232 Free PMC article.
-
A conditional neural fields model for protein threading.Bioinformatics. 2012 Jun 15;28(12):i59-66. doi: 10.1093/bioinformatics/bts213. Bioinformatics. 2012. PMID: 22689779 Free PMC article.
-
Computational analysis of prolyl hydroxylase domain-containing protein 2 (PHD2) mutations promoting polycythemia insurgence in humans.Sci Rep. 2016 Jan 12;6:18716. doi: 10.1038/srep18716. Sci Rep. 2016. PMID: 26754054 Free PMC article.
-
Protein structure homology modeling using SWISS-MODEL workspace.Nat Protoc. 2009;4(1):1-13. doi: 10.1038/nprot.2008.197. Nat Protoc. 2009. PMID: 19131951
References
-
- von Öhsen N, Zimmer R. Improving profile-profile alignment via log average scoring. In: Gascuel O, Moret B, editor. Algorithms in Bioinformatics, First International Workshop, WABI. Springer; 2001. pp. 11–26.
Publication types
MeSH terms
Substances
LinkOut - more resources
Full Text Sources
