

Dissemination of bovine leukemia virus-infected cells from a newly infected sheep lymph node
- PMID: 16873244
- PMCID: PMC1563808
- DOI: 10.1128/JVI.00529-06
Dissemination of bovine leukemia virus-infected cells from a newly infected sheep lymph node
Abstract
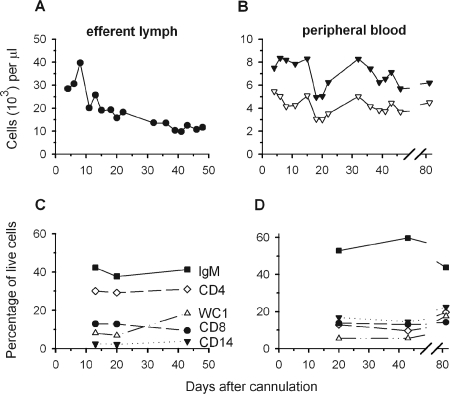
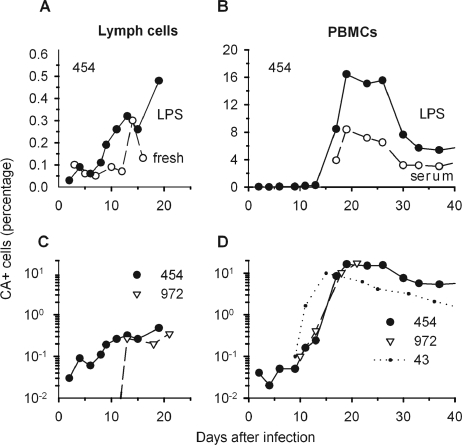
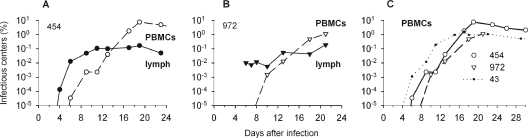
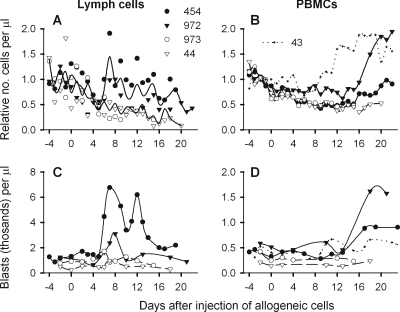
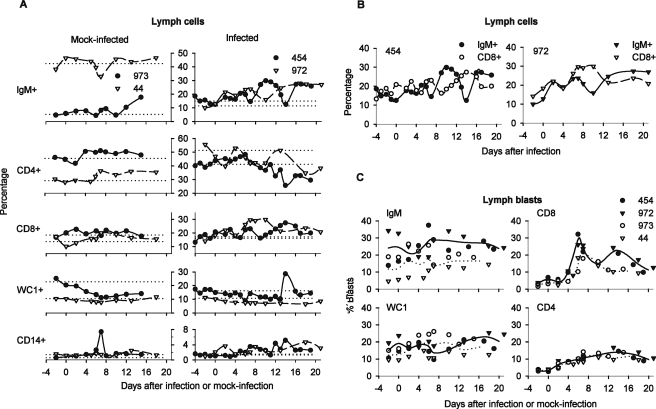
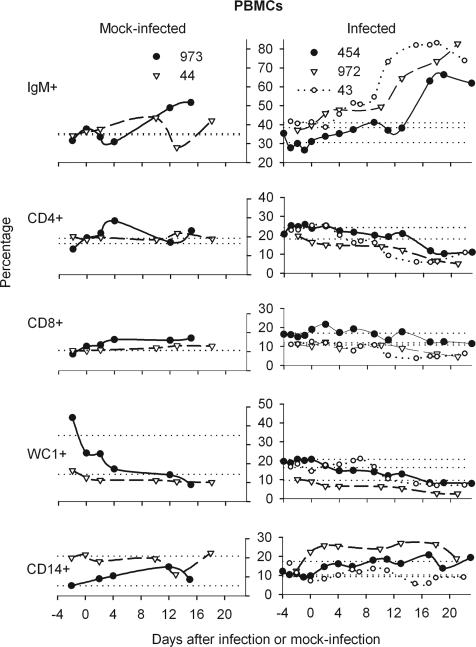
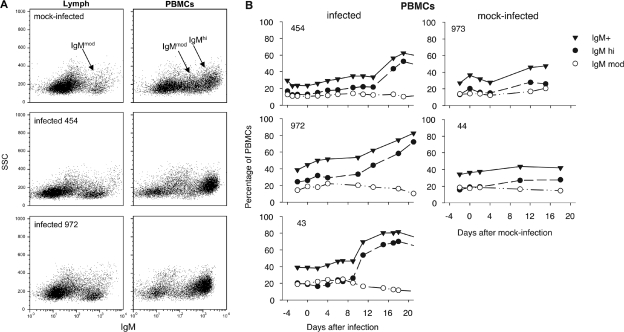
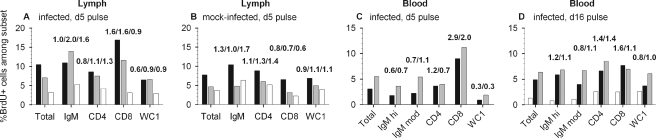
To investigate the early establishment of bovine leukemia virus (BLV) infection, we injected BLV-infected or mock-infected allogeneic cells into the shoulder of sheep in which an efferent lymphatic duct of the draining prescapular lymph node had been cannulated. Rare mononuclear cells acting as centers of BLV infection in culture were present within 4 to 6 days in efferent lymph and within 6 to 10 days in blood. Soon after BLV injection, immunoglobulin M+ (IgM+) and CD8+ cells increased in efferent lymph and oscillated reciprocally in frequency. CD8+ blasts increased on days 4 to 6, when infectious centers increased 100-fold in lymph. On days 6 and 7, both lymph and blood were enriched with CD8+ cells that were labeled late on day 5 with an intravenous pulse of 5-bromo-2'-deoxyuridine (BrdU). Lymph, but not blood, was enriched with BrdU+ B cells on day 7. Capsid-specific antibodies became detectable in efferent lymph on days 6 to 8 and surface glycoprotein-specific antibodies on day 9, preceding their detection in serum by 9 to 14 days. Systemic dissemination of BLV-infected cells was thus accompanied by an increase in proliferating CD8+ cells and the onset of BLV-specific antibodies in lymph. Infectious centers reached maximum frequencies of 0.2% in lymph by days 11 to 13, and then their frequencies increased by 5- to 40-fold in blood cells, suggesting that many infected blood cells do not recirculate back into lymph. Beginning on days 10 to 13, a subpopulation of B cells having high levels of surface IgM increased sharply in peripheral blood. Such cells were not present in lymph. After a day 16 pulse of BrdU, recently proliferated cells that stained intensely for surface IgM appeared in blood within 15 h. Predominantly B lymphocytes contained the viral capsid protein when lymph and blood cells were cultured briefly to allow BLV expression. However, both early in lymph and later in blood, BrdU+ B cells greatly exceeded productively infected cells, indicating that new BLV infections stimulate proliferation of two different populations of B cells.
Figures
Similar articles
-
Emphasis on cell turnover in two hosts infected by bovine leukemia virus: a rationale for host susceptibility to disease.Vet Immunol Immunopathol. 2008 Sep 15;125(1-2):1-7. doi: 10.1016/j.vetimm.2008.04.007. Epub 2008 Apr 16. Vet Immunol Immunopathol. 2008. PMID: 18513803 Review.
-
Effect of infection with bovine leukosis virus on lymphocyte proliferation and apoptosis in dairy cattle.Am J Vet Res. 2011 Aug;72(8):1059-64. doi: 10.2460/ajvr.72.8.1059. Am J Vet Res. 2011. PMID: 21801063
-
Immunopathologic study and characterization of the phenotype of transformed cells in sheep with bovine leukemia virus-induced lymphosarcoma.Am J Vet Res. 1994 Jan;55(1):72-80. Am J Vet Res. 1994. PMID: 8141500
-
Reduced humoral immunity and atypical cell-mediated immunity in response to vaccination in cows naturally infected with bovine leukemia virus.Vet Immunol Immunopathol. 2016 Dec;182:125-135. doi: 10.1016/j.vetimm.2016.10.013. Epub 2016 Oct 23. Vet Immunol Immunopathol. 2016. PMID: 27863543
-
Role of cell-mediated immunity in bovine leukemia virus (BLV) infection in ruminants: its implication for the vaccination strategy against retroviruses.Ther Immunol. 1994 Oct;1(5):297-301. Ther Immunol. 1994. PMID: 7584504 Review.
Cited by
-
Early and transient reverse transcription during primary deltaretroviral infection of sheep.Retrovirology. 2008 Feb 1;5:16. doi: 10.1186/1742-4690-5-16. Retrovirology. 2008. PMID: 18241341 Free PMC article.
-
Frequency of caseous lymphadenitis (CLA) in sheep slaughtered in an abattoir in Tabriz: comparison of bacterial culture and pathological study.Comp Clin Path. 2012 Oct;21(5):667-671. doi: 10.1007/s00580-010-1154-7. Epub 2011 Jan 6. Comp Clin Path. 2012. PMID: 23049493 Free PMC article.
-
Mechanisms of leukemogenesis induced by bovine leukemia virus: prospects for novel anti-retroviral therapies in human.Retrovirology. 2007 Mar 16;4:18. doi: 10.1186/1742-4690-4-18. Retrovirology. 2007. PMID: 17362524 Free PMC article. Review.
References
-
- Aida, Y., M. Miyasaka, K. Okada, M. Onuma, S. Kogure, M. Suzuki, P. Minoprio, D. Levy, and Y. Ikawa. 1989. Further phenotypic characterization of target cells for bovine leukemia virus experimental infection in sheep. Am. J. Vet. Res. 50:1946-1951. - PubMed
-
- Blacklaws, B. A. 1997. Quantification of the reservoir of HIV-1. Trends Microbiol. 5:215-216. - PubMed
-
- Blunt, M. H. 1975. The blood of sheep: composition and function. Springer-Verlag, Berlin, Germany.
-
- Cahill, R., J. B. Hay, H. Frost, and Z. Trnka. 1974. Changes in lymphocyte circulation after administration of antigen. Haematologia 8:321-334. - PubMed
Publication types
MeSH terms
Substances
Grants and funding
LinkOut - more resources
Full Text Sources
Research Materials
