

Global changes in cellular gene expression during bacteriophage PRD1 infection
- PMID: 16873264
- PMCID: PMC1563795
- DOI: 10.1128/JVI.00065-06
Global changes in cellular gene expression during bacteriophage PRD1 infection
Abstract
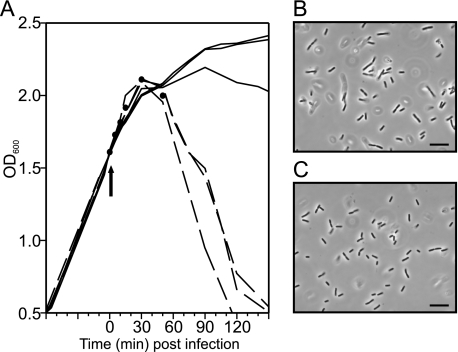
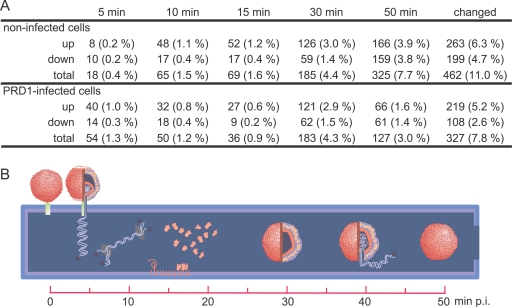
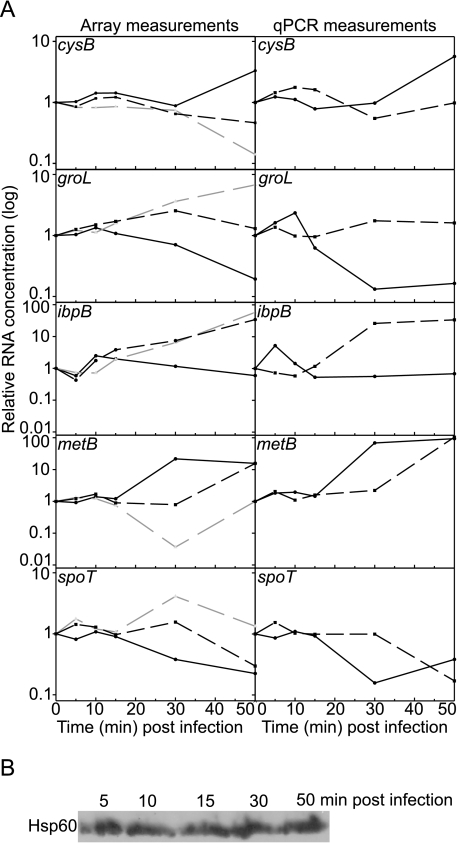
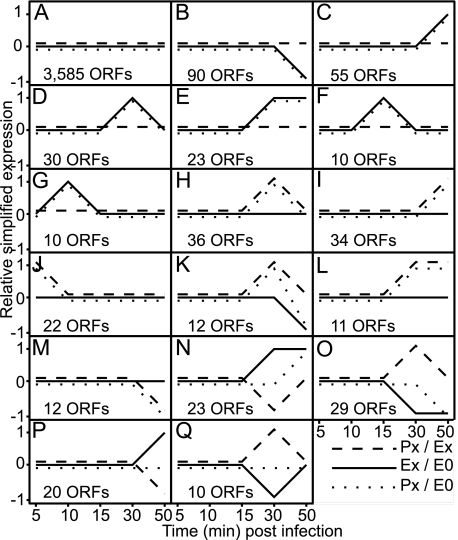
Virus-induced changes in cellular gene expression and host physiology have been studied extensively. Still, there are only a few analyses covering the entire viral replication cycle and whole-host gene pool expression at the resolution of a single gene. Here we report changes in Escherichia coli gene expression during bacteriophage PRD1 infection using microarray technology. Relative mRNA levels were systematically measured for over 99% of the host open reading frames throughout the infection cycle. Although drastic modifications could be detected in the expression of individual genes, global changes at the whole-genome level were moderate. Notably, the majority of virus-induced changes took place only after the synthesis of virion components, indicating that there is no major reprogramming of the host during early infection. The most highly induced genes encoded chaparones and other stress-inducible proteins.
Figures
Similar articles
-
Non-structural proteins P17 and P33 are involved in the assembly of the internal membrane-containing virus PRD1.Virology. 2015 Aug;482:225-33. doi: 10.1016/j.virol.2015.03.049. Epub 2015 Apr 14. Virology. 2015. PMID: 25880114
-
Subcellular localization of bacteriophage PRD1 proteins in Escherichia coli.Virus Res. 2014 Jan 22;179:44-52. doi: 10.1016/j.virusres.2013.11.015. Epub 2013 Nov 28. Virus Res. 2014. PMID: 24291253
-
Lipid-containing viruses: bacteriophage PRD1 assembly.Adv Exp Med Biol. 2012;726:365-77. doi: 10.1007/978-1-4614-0980-9_16. Adv Exp Med Biol. 2012. PMID: 22297522 Review.
-
Involvement of other bacteriophage T4 genes in the blockade of protein synthesis and mRNA destabilization by a mutation of gene 61. 5.Virology. 1998 Aug 15;248(1):148-55. doi: 10.1006/viro.1998.9270. Virology. 1998. PMID: 9705264
-
The plasmid status of satellite bacteriophage P4.Plasmid. 2001 Jan;45(1):1-17. doi: 10.1006/plas.2000.1497. Plasmid. 2001. PMID: 11319927 Review.
Cited by
-
Isolation and Characterization of the Novel Phage JD032 and Global Transcriptomic Response during JD032 Infection of Clostridioides difficile Ribotype 078.mSystems. 2020 May 5;5(3):e00017-20. doi: 10.1128/mSystems.00017-20. mSystems. 2020. PMID: 32371470 Free PMC article.
-
Global Transcriptomic Analysis of Interactions between Pseudomonas aeruginosa and Bacteriophage PaP3.Sci Rep. 2016 Jan 11;6:19237. doi: 10.1038/srep19237. Sci Rep. 2016. PMID: 26750429 Free PMC article.
-
Proteomic and Transcriptomic Analysis of Microviridae φX174 Infection Reveals Broad Upregulation of Host Escherichia coli Membrane Damage and Heat Shock Responses.mSystems. 2021 May 11;6(3):e00046-21. doi: 10.1128/mSystems.00046-21. mSystems. 2021. PMID: 33975962 Free PMC article.
-
Proteomic Characterization of Lytic Bacteriophages of Staphylococcus aureus Isolated from Sewage Affluent of India.Int Sch Res Notices. 2014 Sep 14;2014:265298. doi: 10.1155/2014/265298. eCollection 2014. Int Sch Res Notices. 2014. PMID: 27355013 Free PMC article.
-
The Global Reciprocal Reprogramming between Mycobacteriophage SWU1 and Mycobacterium Reveals the Molecular Strategy of Subversion and Promotion of Phage Infection.Front Microbiol. 2016 Jan 28;7:41. doi: 10.3389/fmicb.2016.00041. eCollection 2016. Front Microbiol. 2016. PMID: 26858712 Free PMC article.
References
-
- Abrescia, N. G., J. J. Cockburn, J. M. Grimes, G. C. Sutton, J. M. Diprose, S. J. Butcher, S. D. Fuller, C. San Martin, R. M. Burnett, D. I. Stuart, D. H. Bamford, and J. K. Bamford. 2004. Insights into assembly from structural analysis of bacteriophage PRD1. Nature 432:68-74. - PubMed
-
- Aranda, M., and A. Maule. 1998. Virus-induced host gene shutoff in animals and plants. Virology 243:261-267. - PubMed
-
- Bamford, D. H., R. M. Burnett, and D. I. Stuart. 2002. Evolution of viral structure. Theor. Popul. Biol. 61:461-470. - PubMed
Publication types
MeSH terms
Substances
LinkOut - more resources
Full Text Sources
Other Literature Sources
