. 2006 Jan-Mar;2(1):39-46.
doi: 10.4161/auto.2229. Epub 2006 Jan 10.

Tracker dyes to probe mitochondrial autophagy (mitophagy) in rat hepatocytes

Affiliations

Tracker dyes to probe mitochondrial autophagy (mitophagy) in rat hepatocytes

Sara Rodriguez-Enriquez et al. Autophagy. 2006 Jan-Mar.

Abstract

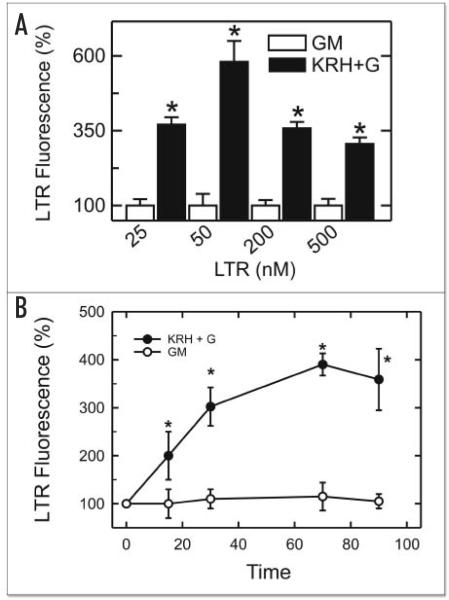
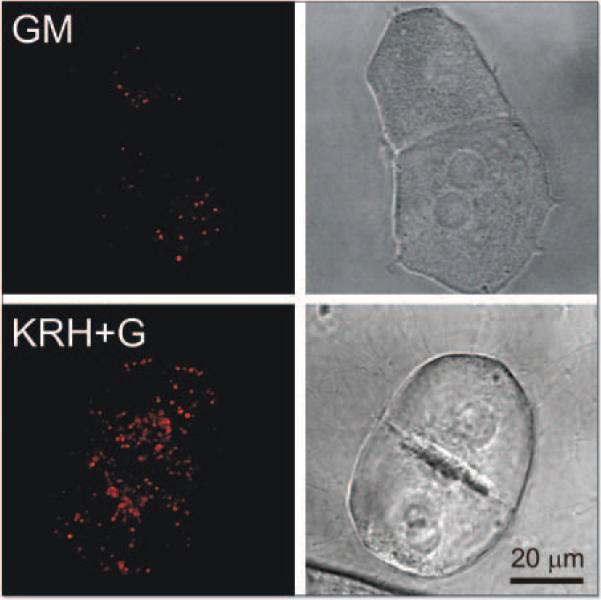
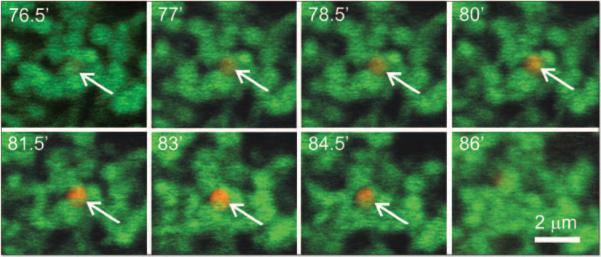
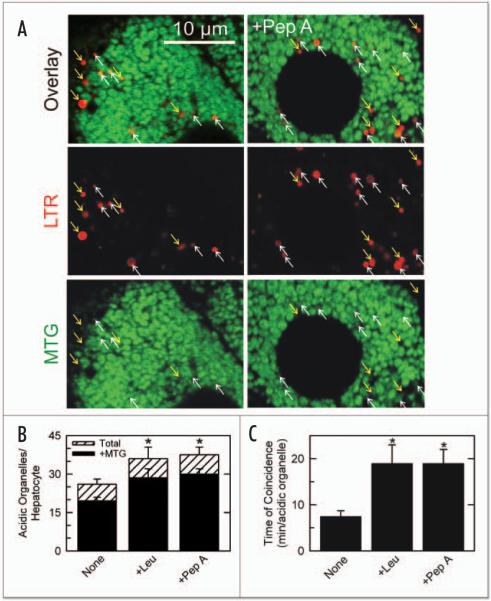
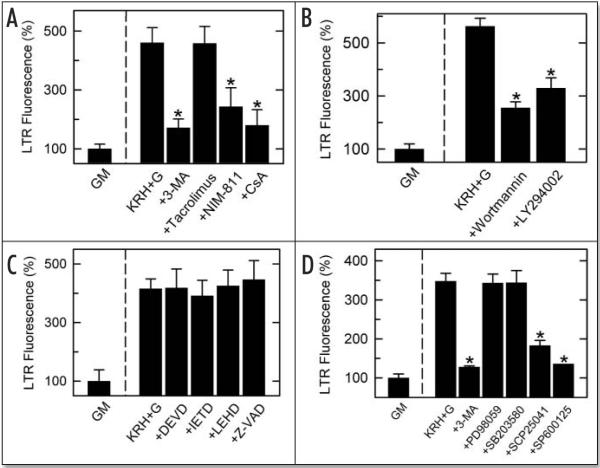
Mitochondria become targets for autophagic degradation after nutrient deprivation, a process also termed mitophagy. In this study, we used LysoTracker Red (LTR) and MitoTracker Green to characterize the kinetics of autophagosomal proliferation and mitophagy in cultured rat hepatocytes. Autophagy induced by nutrient deprivation plus glucagon increased LTR uptake assessed with a fluorescence plate reader and the number of LTR-labeled acidic organelles assessed with confocal microscopy in individual hepatocytes both by 4- to 6-fold. Serial imaging of hepatocytes coloaded with MitoTracker Green (MTG) revealed an average mitochondrial digestion time of 7.5 min after autophagic induction. In the presence of protease inhibitors, digestion time more than doubled, and the total number of LTR-labeled organelles increased about 40%, but the proportion of the LTR-labeled acidic organelles containing MTG fluorescence remained constant at about 75%. Autophagy inhibitors, 3-methyladenine, wortmannin and LY204002, suppressed the increase of LTR uptake after nutrient deprivation by up to 85%, confirming that increased LTR uptake reflected autophagy induction. Cyclosporin A and NIM811, specific inhibitors of the mitochondrial permeability transition (MPT), also decreased LTR uptake, whereas tacrolimus, an immunosuppressive reagent that does not inhibit the MPT, was without effect. In addition, the c-Jun N-terminal kinase (JNK) inhibitors, SCP25041 and SP600125, blocked LTR uptake by 47% and 61%, respectively, but ERK1, p38 and caspase inhibitors had no effect. The results show that mitochondria once selected for mitophagy are rapidly digested and support the concept that mitochondrial autophagy involves the MPT and signaling through PI3 kinase and possibly JNK.


Figures

Figure 1
Figure 1
Increased LTR fluorescence in cultured hepatocytes after autophagic stimulation. In (A), cultured hepatocytes were loaded with 25, 50, 200 and 500 nM LTR after 70 min incubation in complete growth medium (GM) or KRH plus 1 μM glucagon (KRH+G). After another 20 min, LTR fluorescence was measured using a fluorescence plate reader, as described in Materials and Methods. In (B), hepatocytes were loaded with 50 nM LTR, as described in (A). LTR fluorescence was then measured after various times of incubation. *, p < 0.001 vs. complete media (n = 12 except for 25 nM LTR where n = 4).
Figure 2
Figure 2
Confocal and wide field microscopy of LysoTracker Red (LTR) uptake in hepatocytes after autophagic induction. Cultured hepatocytes were loaded with LTR (200 nM, 20 min) and incubated for 70 min in complete growth medium (GM, upper panels) or in KRH plus 1 μM glucagon (KRH+G, lower panels). The left panels show representative superimposed through-focus confocal images of red LTR fluorescence of hepatocytes in growth medium (upper left panel) or KRH plus glucagon (lower left panel). The right panels are corresponding bright images.
Figure 3
Figure 3
Mitochondrial digestion by during autophagy. Cultured hepatocytes were coloaded with MTG (0.5 μM) for 60 min and LTR (0.5 μM) for 20 min at 37°C in complete growth medium. On the microscope stage, complete growth medium was replaced KRH plus 1 μM glucagon, and a time series of confocal images of green MTG fluorescence and red LTR was collected. Time points were selected to illustrate the onset and completion of mitochondrial digestion by autophagy. One experiment representative of 10.
Figure 4
Figure 4
Prolongation of autophagic digestion of mitochondria by proteases inhibitors. In (A), cultured hepatocytes were coloaded with MTG and LTR and placed in KRH plus glucagon, as described in Figure 3, in the absence (left panels) and presence of 7.5 μM pepstatin A (right panels). After 70 min, single confocal images of green MTG and red LTR fluorescence were collected. Upward-pointing white arrows represent the LTR-labeled acidic organelles that colocalized with MTG-labeled mitochondria. Downward-pointing yellow arrows represent LTR-labeled lysosomes that did not colocalize with MTG fluorescence. In (B), the number of LTR-labeled acidic organelles containing MTG fluorescence (black bars) and the total number of LTR-labeled organelles per hepatocyte containing MTG fluorescence in single confocal optical sections (~2 μm thickness) (black bars) and the total number of LTR-labeled organelles per hepatocyte optical section (white bars) are plotted in the absence (None) and presence of pepstatin A (Pep A, 7.5 μM) or leupeptin (Leu, 10 μM). In (C), the duration of colocalization of MTG and LTR in individual autophagosomes was determined from time series of confocal images after autophagic stimulation by KRH plus glucagon in the presence and absence of protease inhibitors, as illustrated in (A). *, p < 0.001 vs. None (n = 6).
Figure 5
Figure 5
LTR fluorescence plate reader screening assay: inhibition of autophagy by agents inhibiting the MPT, PI3 kinase and JNK but not by agents inhibiting caspases, ERK1 and p38. Cultured hepatocytes in growth medium were preincubated 30 min in complete growth medium followed by 70 min incubation in growth medium (GM) or KRH plus 1 μM glucagon (KRH+G). LTR (50 nM) was added, and LTR fluorescence was measured as described in Materials and Methods. As indicated, various inhibitors were added from the beginning of the 30 min preincubation. Agents used were: (A), 10 mM 3-MA, 5 μM tacrolimus (calcineurin inhibitor), 5 μM NIM811 (MPT inhibitor), 5 μM CsA (calcineurin and MPT inhibitor); (B), 0.5 μM wortmannin, 10 μM LY294002 (PI3 kinase inhibitors); C, 100 μM DEVD-fmk (caspase 3 inhibitor), 100 μM IETD-fmk (caspase 8 inhibitor), 100 μM LEHD-cho (caspase 9 inhibitor), 100 μM Z-VAD-fmk (pan caspase inhibitor); D, 10 mM 3-MA, 100 μM PD98059 (ERK1 inhibitor), 100 μM SB203580 (p38 inhibitor), 100 μM SCP25041 (JNK inhibitor), 20 μM SP600125 (JNK inhibitor). *, p < 0.001 compared to KRH+G (n = 12–16 per group except SP600125 where n = 4).

References

    1. Arstila AU, Shelburne DJ, Trump BF. Studies on cellular autophagocytosis. A histochemical study on sequential alterations of mitochondria in the glucagon-induced autophagy vacuoles of rat liver. Lab Invest. 1972;27:317–23. - PubMed
    1. Lardeux BR, Mortimore GE. Amino acid and hormonal control of macromolecular turnover in perfused rat liver. Evidence for selective autophagy. J Biol Chem. 1987;262:14514–9. - PubMed
    1. Shworer CM, Shiffer KA, Mortimer GE. Quantitative relationship between autophagy and the proteolysis during graded amino acid deprivation in perfused rat liver. J Biol Chem. 1981;256:7652–8. - PubMed
    1. Mortimore GE, Poso AR. Intracellular protein catabolism and its control during nutrient deprivation and supply. Annu Rev Nutr. 1987;5:49–70. - PubMed
    1. Yu QC, Marzella L. Response of autophagic protein degradation to physiologic and pathologic stimuli in rat hepatocyte monolayer cultures. Lab Inves. 1988;58:643–52. - PubMed

Publication types

MeSH terms